
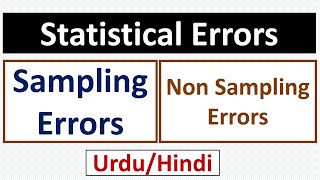
SAMPLING AND NON-SAMPLING ERRORS
Enroll to start learning
You’ve not yet enrolled in this course. Please enroll for free to listen to audio lessons, classroom podcasts and take practice test.
Interactive Audio Lesson
Listen to a student-teacher conversation explaining the topic in a relatable way.
Understanding Data Types
🔒 Unlock Audio Lesson
Sign up and enroll to listen to this audio lesson

Today we will start by understanding the different types of data used in statistics. Can anyone tell me what primary data is?

Isn't primary data the information we collect ourselves for a specific study?
Exactly! Primary data is collected firsthand through methods like surveys or experiments. And what about secondary data?

That would be data collected by someone else, right? Like reports or studies that have already been published?
Correct! Secondary data is processed information that can save us time and resources. Remember, primary = first-hand and secondary = someone else's work. Let's recap: Primary data is typically collected for the specific purpose of your research, and secondary data is already available.
Census vs. Sample Surveys
🔒 Unlock Audio Lesson
Sign up and enroll to listen to this audio lesson

Next, let's talk about how we actually collect data. What do you think a census involves?

A census collects data from everyone in a population!
That's right! A census gathers detailed information on every individual. But this can be very resource-intensive. What’s an alternative?

Oh! Sample surveys! They collect data from a smaller group instead of everyone.
Exactly! Sample surveys are usually quicker and less costly. Could you all remember the benefits of sample surveys by using the acronym 'FAST'? F for faster data collection, A for affordable, S for statistically significant, and T for targeted insights.
Understanding Errors
🔒 Unlock Audio Lesson
Sign up and enroll to listen to this audio lesson
Now, let’s dive into errors. Who can summarize what a sampling error is?
A sampling error happens when the sample doesn’t represent the population well.
Good! It could occur if the sample size is too small or if there's bias in selecting sample members. What about non-sampling errors?
Those errors come from how the data is gathered or recorded, like if someone mishears a response or if someone refuses to answer!
Precisely! Non-sampling errors can skew results even if the sample is representative. A great way to remember this is by associating sampling errors with 'selection' and non-sampling errors with 'collection'.
Practical Applications of Sampling
🔒 Unlock Audio Lesson
Sign up and enroll to listen to this audio lesson
Finally, let’s discuss how we can minimize sampling errors. What do you think is important when designing a sample?
The sample should be random, so everyone has an equal chance to be included!
Absolutely! Random selection reduces bias significantly. Also, increasing sample size can help—can anyone explain why?
Because a larger sample better reflects the population!
Exactly! Remember, larger samples lower sampling errors. Let's sum up: to reduce sampling errors, aim for random selection and consider larger groups. ‘R’ for Random and ‘L’ for Larger—'RL'! Great job, everyone!
Introduction & Overview
Read summaries of the section's main ideas at different levels of detail.
Quick Overview
Standard
In this section, we explore the distinctions between primary and secondary data, methods of data collection including Census and Sample Surveys, and the concepts of sampling and non-sampling errors, which influence the accuracy of statistical estimates.
Detailed
Sampling and Non-Sampling Errors
This section focuses on two critical aspects of data collection in statistics: sampling errors and non-sampling errors. Sampling errors occur when there is a discrepancy between the characteristics of a sample and those of a population due to the sample size or selection method. Non-sampling errors, on the other hand, arise from issues in the survey process, such as misrecorded data or non-response biases. Understanding these errors is essential for researchers because they can significantly affect the validity and reliability of findings derived from statistical analyses.
Key concepts covered in this section include:
- Primary Data vs. Secondary Data: Primary data are collected firsthand through methods such as surveys and interviews, while secondary data are obtained from previously published sources.
- Census vs. Sample Surveys: A census gathers data from every member of a population, while sample surveys collect data from a subset, which may be more cost-effective and time-efficient.
- Sampling Methods: Random sampling provides all individuals an equal chance of selection, while non-random sampling may introduce bias.
- Types of Errors: The section differentiates between sampling errors (due to incorrect sample selection) and non-sampling errors (due to data collection issues).
By recognizing and addressing these errors, researchers can enhance the quality of their statistical data and provide more accurate insights.
Youtube Videos


Audio Book
Dive deep into the subject with an immersive audiobook experience.
Understanding Sampling Errors
Chapter 1 of 5
🔒 Unlock Audio Chapter
Sign up and enroll to access the full audio experience
Chapter Content
Sampling error refers to the difference between the sample estimate and the corresponding population parameter (actual value of the characteristic of the population for example, average income, etc). Thus, the difference between the actual value of a parameter of the population and its estimate (from the sample) is the sampling error. It is possible to reduce the magnitude of sampling error by taking a larger sample.
Detailed Explanation
Sampling errors occur when there is a discrepancy between the value obtained from a sample and the value of the entire population. For example, if you calculate the average income of a few selected individuals (your sample), that average might not perfectly match the average income of everyone in the population. The larger your sample size, the more likely it is that your sample's average will approximate the true average of the whole population.
Examples & Analogies
Imagine you're trying to guess the average height of all the students in a school by measuring just a few. If you measure a group where the basketball players happen to be overrepresented, your average height might be inaccurately high. But if you measure a larger, more diverse group, your average will be much closer to the actual average height.
Identifying Sampling Bias
Chapter 2 of 5
🔒 Unlock Audio Chapter
Sign up and enroll to access the full audio experience
Chapter Content
Sampling bias occurs when the sampling plan is such that some members of the target population could not possibly be included in the sample.
Detailed Explanation
Sampling bias reflects a flaw in the selection of individuals for the survey. It means certain groups within the population are either overrepresented or underrepresented in your sample, which skew results. This often happens if the sample is taken from a non-random population subset, resulting in a lack of diversity in the data gathered.
Examples & Analogies
Think of polling voters about an election by only asking people at a political rally. This would lead to biased results as the answers will likely reflect the views of the most enthusiastic supporters, not the general electorate.
Understanding Non-Response Errors
Chapter 3 of 5
🔒 Unlock Audio Chapter
Sign up and enroll to access the full audio experience
Chapter Content
Non-response occurs if an interviewer is unable to contact a person listed in the sample or a person from the sample refuses to respond. In this case, the sample observation may not be representative.
Detailed Explanation
Non-response errors mean that some individuals selected to be part of the sample do not provide data due to various reasons, such as unavailability or refusal to participate. This can lead to a sample that does not accurately reflect the population, which impacts the reliability of the results.
Examples & Analogies
Imagine you send out 100 invitations to your birthday party, but only half of the people reply. If the ones who didn't respond might have different tastes than those who did, your understanding of how enjoyable your birthday party was could be skewed.
Errors in Data Acquisition
Chapter 4 of 5
🔒 Unlock Audio Chapter
Sign up and enroll to access the full audio experience
Chapter Content
This type of error arises from recording incorrect responses. Suppose, the teacher asks students to measure the length of the teacher’s table in the classroom. The measurement by the students may differ due to differences in measuring tape, carelessness of students, etc.
Detailed Explanation
Errors in data acquisition happen during the process of data collection, where information may be inaccurately recorded due to misunderstandings, inaccuracies in measurement tools, or even typographical errors when transcribing data.
Examples & Analogies
Picture a group of friends timing how long it takes to run a lap around the park. If one person is distracted and mistakenly thinks they saw someone take a minute when it was really 1 minute and 15 seconds, their recorded time is incorrect. Their error could lead to a flawed understanding of how fast everyone runs.
Understanding Non-Sampling Errors
Chapter 5 of 5
🔒 Unlock Audio Chapter
Sign up and enroll to access the full audio experience
Chapter Content
Non-sampling errors are more serious than sampling errors because a sampling error can be minimised by taking a larger sample. It is difficult to minimise non-sampling error, even by taking a large sample. Even a Census can contain non-sampling errors.
Detailed Explanation
Non-sampling errors can occur due to flaws in the data collection process, such as incorrect surveying techniques or biased questions. These errors cannot typically be corrected by increasing the sample size and can significantly affect the overall findings.
Examples & Analogies
Imagine you conduct a survey about people's opinions on pizza, but you ask leading questions like 'Don’t you think everyone loves pizza?' This could influence how people respond, negatively affecting the accuracy and credibility of your survey results.
Key Concepts
-
Primary Data: Information collected first-hand by the researcher.
-
Secondary Data: Information collected from previously published sources.
-
Census: A complete enumeration of a population.
-
Sample Survey: A method for gathering data from a subset of a population.
-
Sampling Error: Variation between the sample mean and the true population mean.
-
Non-Sampling Error: Mistakes arising from data collection processes.
Examples & Applications
An example of primary data is a survey conducted to understand consumer preferences for a new product.
An example of secondary data is using census data to analyze population growth trends.
Memory Aids
Interactive tools to help you remember key concepts
Rhymes
Primary data’s a first-hand deed,
Stories
Once upon a time, a researcher named Sam wanted to know the favorite ice cream flavor of his friends. Instead of asking everyone, he asked just a sample, thus creating primary data. However, his neighbor had already conducted a survey on the same topic and shared the results—secondary data. Sam learned quickly which method could provide faster results!
Memory Tools
For types of errors, remember S & N - Sampling and Non-sampling errors, where S means 'selection' errors, and N means 'collection' errors.
Acronyms
Remember 'RSF' for sampling methods
for Random
for Stratified
and F for Fixed.
Flash Cards
Glossary
- Primary Data
Data collected firsthand for a specific research purpose.
- Secondary Data
Data that has been previously collected and published by others.
- Census
A survey that collects data from every member of the population.
- Sample Survey
A method of collecting data from a subset of a population.
- Sampling Error
The difference between a sample estimate and the corresponding population parameter.
- NonSampling Error
Errors resulting from the data collection process, such as misrecorded responses.
- Random Sampling
A sampling method where each individual has an equal chance of being selected.
- NonRandom Sampling
A sampling method based on the researcher's judgment rather than random selection.
Reference links
Supplementary resources to enhance your learning experience.