
Slope-Intercept Form
Enroll to start learning
You’ve not yet enrolled in this course. Please enroll for free to listen to audio lessons, classroom podcasts and take practice test.
Interactive Audio Lesson
Listen to a student-teacher conversation explaining the topic in a relatable way.
Understanding the Slope-Intercept Form
🔒 Unlock Audio Lesson
Sign up and enroll to listen to this audio lesson

Today, we're focusing on the slope-intercept form of a linear equation, which is written as y = mx + c. Who can tell me what 'm' represents?

Is 'm' the slope?
Exactly! The slope 'm' tells us how steep the line is. Can anyone explain what 'c' represents?

That's the y-intercept, where the line crosses the y-axis!
Right! Now, remember, we can use this information to graph our equations. Let's move on to plotting this form.
Graphing Linear Equations
🔒 Unlock Audio Lesson
Sign up and enroll to listen to this audio lesson

To graph a linear equation in the form y = mx + c, what should we do first?

First, we find the y-intercept 'c' and plot that point.
That's correct! After plotting the intercept, how do we find another point on the line using the slope 'm'?

We use the rise over run method! If the slope is 2, we go up 2 and over 1.
Great! Let's practice this with an example equation.
Application of Slope-Intercept Form
🔒 Unlock Audio Lesson
Sign up and enroll to listen to this audio lesson
Can anyone think of a real-world situation where we might need to use the slope-intercept form?
I think it can be used in budgeting, like if I'm calculating costs.
Excellent example! The equation can model things like expenses versus time. What about the slope in that scenario?
The slope would show how much money I'm spending per month, right?
Exactly! And the y-intercept would tell us the initial cost or balance when we start. Let's create one together.
Introduction & Overview
Read summaries of the section's main ideas at different levels of detail.
Quick Overview
Standard
This section introduces the slope-intercept form of linear equations, detailing its components: the slope (m) and y-intercept (c). Students learn how to graph linear equations using this form and understand its significance in interpreting the relationship between variables.
Detailed
Slope-Intercept Form
The slope-intercept form of a linear equation is given by the equation: y = mx + c. Here:
- m represents the slope of the line, which indicates the rate of change of y with respect to x.
- c represents the y-intercept, the point at which the line crosses the y-axis (where x = 0).
Key Points
- Definition: This equation allows for easy identification of the slope and y-intercept, essential for graphing linear equations.
- Plotting Steps:
- Identify the slope (m) and y-intercept (c).
- Plot the y-intercept point on the graph.
- Use the slope to find another point on the line by moving a certain rise over run.
- Draw the line through these points.
- Applications: Slope-intercept form is vital in interpreting real-world applications, such as calculating rates, budgets, and other relationships that can be modeled linearly.
Understanding and mastering the slope-intercept form is fundamental to solving and graphing linear equations effectively.
Audio Book
Dive deep into the subject with an immersive audiobook experience.
Understanding Slope-Intercept Form
Chapter 1 of 2
🔒 Unlock Audio Chapter
Sign up and enroll to access the full audio experience
Chapter Content
The most common form is:
𝑦 = 𝑚𝑥 + 𝑐
Where:
• 𝑚 is the slope (rate of change)
• 𝑐 is the y-intercept (where the line crosses the y-axis)
Detailed Explanation
The slope-intercept form is a way of writing a linear equation that makes it easy to understand how the line behaves on a graph. In this equation, 'y' represents the dependent variable, which is the output of a function based on 'x'. The 'm' in this equation represents the slope of the line, which indicates how steep the line is. The value 'c' represents the y-intercept, which is the point where the line crosses the y-axis. Therefore, when plotting a linear equation, the slope determines the angle of the line, while the y-intercept provides a starting point on the graph.
Examples & Analogies
Think of a car driving on a straight road. The slope (m) represents how fast the car is going uphill or downhill; a positive slope means it's moving up, and a negative slope means it’s going down. The starting point (c) where the car is currently parked represents where the car would be on the y-axis when ‘x’ is equal to zero – it's like finding out how far you are from your destination before even starting your journey.
Plotting Steps for Linear Equations
Chapter 2 of 2
🔒 Unlock Audio Chapter
Sign up and enroll to access the full audio experience
Chapter Content
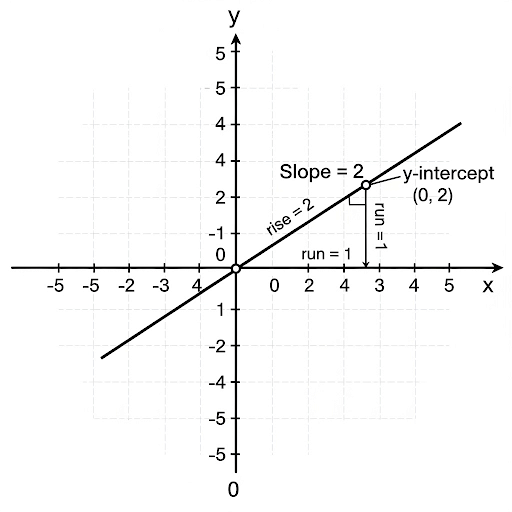
🔹 Plotting Steps
1. Identify slope 𝑚 and y-intercept 𝑐.
2. Plot the point (0,𝑐) on the y-axis.
3. Use the slope 𝑚 = (rise/run) to find the next point.
4. Draw a straight line through the points.
Detailed Explanation
Plotting a linear equation using the slope-intercept form involves several steps that help visualize the relationship represented by the equation. First, identify the slope (m) and the y-intercept (c). The y-intercept is simply the point where the line crosses the y-axis and can be plotted directly on the graph. Next, the slope tells you how to move from the y-intercept to locate other points. For instance, if the slope is 2, it means for every 2 units you go up (rise), you move 1 unit to the right (run). After identifying enough points using this method, connect them with a straight line to represent the linear relationship.
Examples & Analogies
Imagine you're planting a garden along a straight path. The y-intercept tells you where you start planting (at the y-axis). If your slope is 2, you can think of it as moving up 2 steps for every 1 step you take forward. So, as you walk forward on the path, every time you move 1 step, you know to then rise up 2 feet! By following these steps, you're plotting your flowers in a neat line, just like plotting points on a graph.
Key Concepts
-
Slope-Intercept Form: A method to express linear equations as y = mx + c.
-
Slope (m): Defines the rate of change in the y-value against the x-value.
-
Y-Intercept (c): Indicates where the line crosses the y-axis.
Examples & Applications
Example 1: Given the equation y = 2x + 3, the slope is 2 and the y-intercept is 3.
Example 2: To graph y = -x + 1, plot the point (0, 1) and then use the slope of -1 to find another point.
Memory Aids
Interactive tools to help you remember key concepts
Rhymes
Slope and intercept, in forms they made, they'll guide your graphing, unafraid.
Stories
Imagine you are a mountain climber. The slope tells you how steep the mountain is, while the y-intercept is the base camp where you begin.
Memory Tools
Remember: 'S = m (slope) + c (y-intercept)' - Slope Mary Can! (S = m + c)
Acronyms
GMS - Get My Slope
To graph
Identify the y-intercept
use the slope
and then draw!
Flash Cards
Glossary
- Slope
The steepness of a line, represented by 'm' in the equation y = mx + c.
- YIntercept
The point where the line crosses the y-axis, represented by 'c' in the equation.
- Linear Equation
An equation that creates a straight line when graphed, typically in the format ax + by = c.
Reference links
Supplementary resources to enhance your learning experience.