
What is a Linear Function?
Enroll to start learning
You’ve not yet enrolled in this course. Please enroll for free to listen to audio lessons, classroom podcasts and take practice test.
Interactive Audio Lesson
Listen to a student-teacher conversation explaining the topic in a relatable way.
Definition of Linear Functions
🔒 Unlock Audio Lesson
Sign up and enroll to listen to this audio lesson

Alright class, today we are going to explore linear functions. What do you know about them?

I think linear functions are equations that create straight lines!
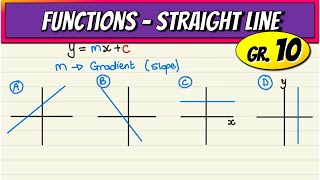
Exactly! A linear function can be expressed in the form 𝑓(𝑥) = 𝑚𝑥 + 𝑐. In this equation, 𝑓(𝑥) is the output, 𝑥 is the input, 𝑚 is the slope, and 𝑐 is the y-intercept.

What's the slope mean, though?
Great question! The slope tells us how steep the line is and its direction. Remember, a positive slope rises from left to right, while a negative slope falls. You can think of slope as how fast something changes!

So if the slope is 0, does that mean the line is flat?
Exactly, Student_3! A zero slope means the line is horizontal. So let’s remember: slope = steepness.

What about the y-intercept?
The y-intercept is the point where the line crosses the y-axis. In the function's equation, it's the value of c. Think of it as where your line starts on the graph.
To sum up: linear functions result in straight lines, where slope defines the angle, and the y-intercept marks the starting point!
Understanding and Calculating Slopes
🔒 Unlock Audio Lesson
Sign up and enroll to listen to this audio lesson

Now that we understand the basics, let’s dive into calculating the slope between two points. Can anyone remind me how to do that?
Is it something to do with the change in y over the change in x?
Correct! The formula for the slope m is m = (𝑦₂ - 𝑦₁) / (𝑥₂ - 𝑥₁). If I use points A(1, 3) and B(3, 7), what would the slope be?
Let’s see… (7-3)/(3-1) which is 4/2 equals 2!
Great job! Knowing how to find the slope enables us to understand how steeply a line rises or falls. Remember: positive means it rises, negative means it falls.
Can slopes be equal for different lines?
Absolutely! Lines with equal slopes are parallel. That’s a key point in understanding how lines behave together in graphs.
So remember, when calculating slopes, use the coordinates wisely!
Graphing Linear Functions
🔒 Unlock Audio Lesson
Sign up and enroll to listen to this audio lesson
Now, let’s learn how to graph a linear function! Can someone tell me the first step?
We need to find the y-intercept first, right?
Correct! Plot the y-intercept on the graph, that’s where the line will start. After that, what’s next?
We use the slope to find more points!
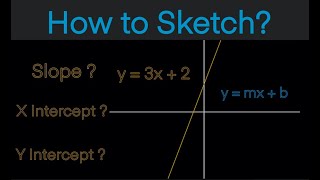
Exactly! Use ‘rise over run’ to move from the y-intercept to plot additional points. For example, if we graph y = -2x + 4, we start at (0, 4), go down 2 units, and right 1 unit.
And then we draw a line through the points, correct?
Yes, that’s right! You’ve got it! Always remember to connect the dots with a straight line.
Identifying Intercepts
🔒 Unlock Audio Lesson
Sign up and enroll to listen to this audio lesson
Let’s explore intercepts now. Who knows what a y-intercept is?
It’s where the line crosses the y-axis!
Correct! And how do we find it in the equation?
It’s just the value of c in the equation!
Exactly right! And what about the x-intercept?
That’s where the line crosses the x-axis when y equals zero!
Yes! To find the x-intercept, set y to zero and solve for x. For example, in y = 3x - 6, if we set y to 0, we find x = 2.
So we can find both intercepts easily from an equation?
Absolutely! This knowledge helps you graph more efficiently. Remember, intercepts are key points for plotting lines.
Introduction & Overview
Read summaries of the section's main ideas at different levels of detail.
Quick Overview
Standard
This section introduces linear functions, emphasizing their definition, the slope and intercepts' significance, and the process of graphing. Furthermore, it links these concepts to real-life applications and prepares students for deeper mathematical explorations.
Detailed
What is a Linear Function?
A linear function is defined as a function whose graph forms a straight line, expressed in the form 𝑓(𝑥) = 𝑚𝑥 + 𝑐. Here, 𝑓(𝑥) or 𝑦 is the dependent variable, 𝑥 is the independent variable, 𝑚 represents the slope of the line, which indicates its steepness and direction, while 𝑐 denotes the y-intercept, where the line intersects the y-axis. 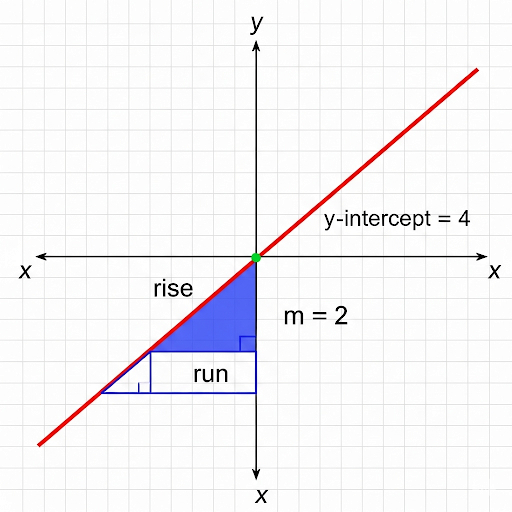
Importance of Slope and Intercepts
The slope conveys critical information about the function's behavior. Positive slopes indicate a rising line, negative slopes a falling line, and zero slope means the line is horizontal. X-intercept and Y-intercept help locate crucial points of intersection on the graph. 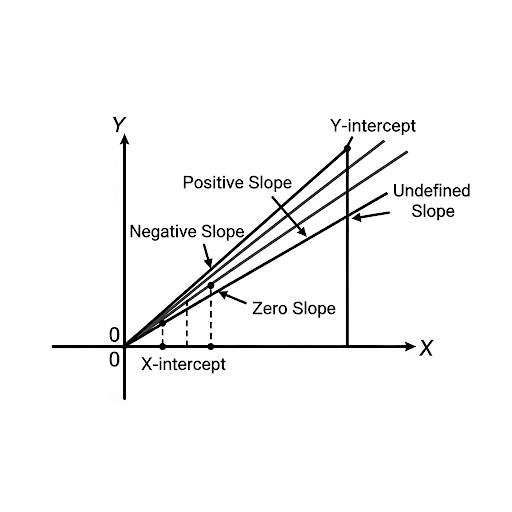
Graphing Linear Functions
To graph a linear function, one starts by determining the y-intercept and then uses the slope to plot additional points, connecting them to establish a straight line.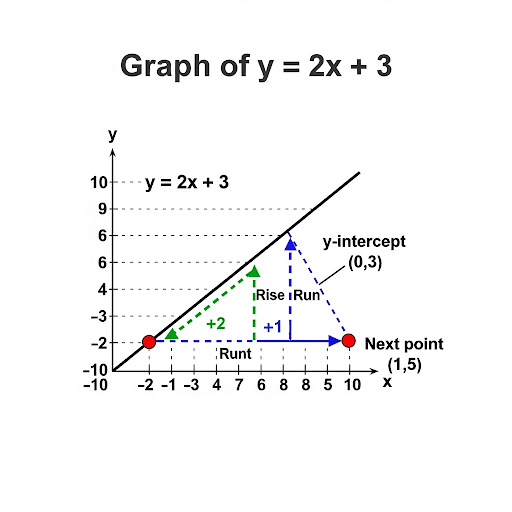
Applications
Linear functions are vital in various real-world scenarios, influencing aspects such as economics, physics, and everyday life. Through examples and exercises, this foundational knowledge sets the stage for advanced studies in mathematics.
Youtube Videos


Audio Book
Dive deep into the subject with an immersive audiobook experience.
Definition of a Linear Function
Chapter 1 of 1
🔒 Unlock Audio Chapter
Sign up and enroll to access the full audio experience
Chapter Content
A linear function is a function that graphs to a straight line. It can be expressed in the form:
\( f(x) = mx + c \)
Where:
• \( f(x) \) or \( y \) is the output (dependent variable)
• \( x \) is the input (independent variable)
• \( m \) is the slope (gradient) of the line
• \( c \) is the y-intercept (where the line crosses the y-axis)
Detailed Explanation
A linear function is a specific type of function that, when graphed, creates a straight line. The equation \( f(x) = mx + c \) helps us understand its components:
- \( f(x) \) (or \( y \)) is the output value we get when we input a value for \( x \).
- \( x \) is the value we choose as the input.
- \( m \) represents the slope, which indicates how steep the line is and its direction.
- \( c \) is where the line crosses the y-axis, known as the y-intercept. This means when \( x = 0 \), the value of \( y \) will be \( c \). For example, if \( c = 3 \), the line will intersect the y-axis at the point (0,3).
Examples & Analogies
Think of a linear function like a ramp. If you push a wheelchair up a ramp, the steeper the ramp (higher slope), the more effort it takes to go up. Just like the ramp's slope, a linear function's slope tells us how steep the graph is. The starting point, where the ramp touches the ground, is similar to the y-intercept in the function.
Key Concepts
-
Linear Function: A function that graphs to a straight line, represented in the form 𝑓(𝑥) = 𝑚𝑥 + 𝑐.
-
Slope: Describes the steepness or gradient of a line and is calculated by the change in y divided by the change in x.
-
Y-intercept: The point where the line crosses the y-axis, indicated by c in the function.
-
X-intercept: The point where the line crosses the x-axis, determined by setting y to zero.
-
Graphing: The method of plotting the function on a coordinate grid to visualize it.
-
Parallel Lines: Lines that have identical slopes and never touch.
-
Perpendicular Lines: Lines that intersect at right angles, with slopes that are negative reciprocals.
Examples & Applications
For f(x) = 2x + 3, the slope is 2 and it crosses the y-axis at 3.
For f(x) = 4x - 1, identify the y-intercept by noting c as -1.
Memory Aids
Interactive tools to help you remember key concepts
Rhymes
For every slope that does not bend, a straight-line graph is your friend!
Stories
Imagine a road that you must travel straight down—the path is simple with no turns, just like linear functions that chart their course!
Memory Tools
Remember ‘SILVER’ for Linear functions: Slope, Intercept, Linearity, Visual, Examples, Real-world applications.
Acronyms
GSL
Graphing requires Slope and y-intercept.
Flash Cards
Glossary
- Linear Function
A function whose graph is a straight line, represented as 𝑓(𝑥) = 𝑚𝑥 + 𝑐.
- Slope
The steepness of the line, indicating the rate of change, calculated as (𝑦₂ - 𝑦₁) / (𝑥₂ - 𝑥₁).
- Yintercept
The point where the line crosses the y-axis, represented by the constant c in the equation.
- Xintercept
The point where the line crosses the x-axis, found by setting the output y to zero.
- Graphing
The process of plotting points and drawing lines to visualize mathematical functions.
- Parallel Lines
Lines that have the same slope and never intersect.
- Perpendicular Lines
Lines whose slopes are negative reciprocals of each other.
Reference links
Supplementary resources to enhance your learning experience.