
Standard Deviation & Variance
Enroll to start learning
You’ve not yet enrolled in this course. Please enroll for free to listen to audio lessons, classroom podcasts and take practice test.
Interactive Audio Lesson
Listen to a student-teacher conversation explaining the topic in a relatable way.
Understanding Mean
🔒 Unlock Audio Lesson
Sign up and enroll to listen to this audio lesson

Today we will start with the mean, which is often referred to as the average. Does anyone know how to calculate the mean?

Isn't it just adding all the numbers together and then dividing by how many there are?
Exactly! The formula is the sum of all data values divided by the number of values. It’s represented as 𝑥̅ = ∑𝑥ᵢ / 𝑛. This gives us a central point around which our data is distributed.

How does that help us understand how spread out the data is?
Great question! The mean alone doesn’t tell us about the spread. This is where we introduce variance and standard deviation.

Can you explain how variance works?
Sure! Variance measures how far each data point is from the mean and thus from every other data point. We find it by calculating the average of the squared differences from the mean.

So that’s why we square the differences, to avoid negatives!
Correct! It ensures that we are measuring the spread without any cancellation of numbers.
Variances and Standard Deviations
🔒 Unlock Audio Lesson
Sign up and enroll to listen to this audio lesson

Let's talk about variance. For a population, we use the formula 𝜎² = ∑(𝑥 − 𝜇)² / 𝑁. Who can tell me what each symbol represents?
𝜎 is the standard deviation, right?
Not quite, 𝜎² is the variance. 𝜇 is the population mean, ∑(𝑥 − 𝜇)² is the sum of the squared deviations, and 𝑁 is the population size. Do you see why we divide by 𝑁?
Because we want the average of those squared differences.
Exactly! Now, for the standard deviation, we simply take the square root of the variance. This gives us a measure in the same scale as our data.
Can you give an example of how this works?
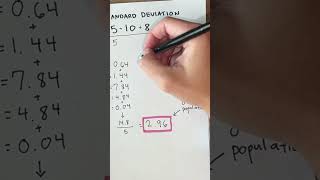
Absolutely! Let’s say we have marks: 3, 5, 7, 5, and 10. First, we find the mean, then the deviations, square them, calculate variance, and finally derive the standard deviation.
That sounds like a lot of steps!
It may seem so, but once we practice, it becomes easier. Let's summarize what we learned: variance shows how spread out our values are, while standard deviation helps to express that spread in a meaningful way.
Application to Grouped Data
🔒 Unlock Audio Lesson
Sign up and enroll to listen to this audio lesson
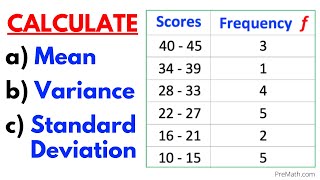
Now that we’ve covered basic data set calculations, let’s look at grouped data. For grouped data, we use midpoints and frequencies. The mean is calculated as 𝑥̅ = ∑𝑓𝑥 / ∑𝑓. What does 𝑓 represent?
It represents the frequency of each class!
Absolutely! After finding the mean, we multiply the frequency by the squared differences from the mean to find variance. Can anyone give me an example of grouped data?
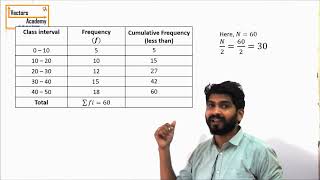
What about marks distributed in intervals like 0-10, 10-20, loading towards higher marks?
Great example! We can calculate it step by step, using midpoints of each interval. This helps us estimate variance and standard deviation for large sets of data.
What's the importance of knowing these measures?
Good question! Knowing variance and standard deviation is crucial in fields like finance for risk analysis or in quality control to ensure product standards.
So they help understand the reliability of data?
Exactly! This understanding helps us make more informed decisions.
Introduction & Overview
Read summaries of the section's main ideas at different levels of detail.
Quick Overview
Youtube Videos

Audio Book
Dive deep into the subject with an immersive audiobook experience.
Introduction to Measures of Dispersion
Chapter 1 of 1
🔒 Unlock Audio Chapter
Sign up and enroll to access the full audio experience
Chapter Content
In everyday life, we often observe variation in data—be it in test scores, heights of students, or daily temperatures. Measures of central tendency (like mean or median) tell us where data is centered, but they don't reveal how spread out the data is. For that, we need measures of dispersion, and two key ones are Variance and Standard Deviation.
Detailed Explanation
In statistics, understanding how data varies or spreads is essential because it gives us context on the consistency of the data. While measures like mean provide a central value, they don't show how far individual data points might be from that average. Therefore, concepts like variance and standard deviation become vital. Variance measures the average of the squared deviations from the mean, while standard deviation is the square root of that variance, providing a measure that is in the same units as the data.
Examples & Analogies
Think of it like a classroom where students receive different test scores. Just knowing the average score (mean) can be misleading if some students scored very high while others scored very low. Thus, knowing how much the scores deviate from the average (using variance and standard deviation) gives teachers better insight into overall student performance.
Key Concepts
-
Variance: A measure of dispersion indicating average squared deviations from the mean.
-
Standard Deviation: The square root of variance, giving insight into data spread.
-
Grouped Data: Data organized into intervals that require specific methods for calculating mean and standard deviation.
Examples & Applications
For data points 3, 5, 7, 5, and 10, the mean is 6, variance is 7, and the standard deviation is approximately 2.65.
Steps for the data points 3, 5, 7, 5, and 10 :
Step 1: Mean
\[
\text{Mean} = \frac{3 + 5 + 7 + 5 + 10}{5} = \frac{30}{5} = 6
\]
Step 2: Variance
\[
\text{Variance} = \frac{(3-6)^2 + (5-6)^2 + (7-6)^2 + (5-6)^2 + (10-6)^2}{5}
\]
\[
= \frac{9 + 1 + 1 + 1 + 16}{5} = \frac{28}{5} = 5.6
\]
Step 3: Standard Deviation
\[
\text{SD} = \sqrt{5.6} \approx 2.37
\]
Final Answer:
Mean = 6, Variance = 5.6, Standard Deviation ≈ 2.37
For grouped data with intervals like 0–10, 10–20, and frequencies associated with them, the standard deviation can be calculated using class midpoints.
Memory Aids
Interactive tools to help you remember key concepts
Rhymes
When you find the spread of data, let the squares take a shot; square those diffs from the mean, give variance a thought.
Stories
Imagine a class giving their test scores. The teacher found the average, but some scores were way off the list. By calculating variance, they realized some students were lost in the mist!
Memory Tools
To remember the steps: Mean, Deviations, Square, Average. 'MDSA' helps you process—mean first, then handle!
Acronyms
DIVE—Deviation, Interval, Variance, Evaluation. Use it to remember the flow in calculating std. deviation!
Flash Cards
Glossary
- Mean
The average of a set of numbers, calculated by dividing the sum of all values by the number of values.
- Variance
A measure of how far each number in a set is from the mean, calculated as the average of the squared differences from the mean.
- Standard Deviation
The square root of the variance, representing the average distance of each data point from the mean in the same units as the data.
- Population
The complete set of items or individuals from which a sample can be drawn.
- Sample
A subset of individuals or observations selected from a population.
Reference links
Supplementary resources to enhance your learning experience.