
Cross‐National Income Gaps
Enroll to start learning
You’ve not yet enrolled in this course. Please enroll for free to listen to audio lessons, classroom podcasts and take practice test.
Interactive Audio Lesson
Listen to a student-teacher conversation explaining the topic in a relatable way.
Per-Capita GDP Estimates
🔒 Unlock Audio Lesson
Sign up and enroll to listen to this audio lesson

Let's begin our discussion with per-capita GDP estimates. In 1800, Britain had a per-capita GDP of $1,100, while India and Qing China stood at $550 and $600 respectively. Can anyone explain what this means in terms of national wealth?

It suggests that Britain's economy was much stronger compared to India and China at that time.
Exactly! This significant difference illustrates the beginning of what we call the 'Great Divergence'. Can anyone point out what might have caused this gap?

Maybe it has to do with industrialization and trade practices in Britain?
Correct! Industrialization played a key role. Now, how does this disparity in GDP relate to our lives today?

It shows how historical economies affect current global inequalities.
Well put! The implications of these differences are long-lasting.
Income Stratification Within Countries
🔒 Unlock Audio Lesson
Sign up and enroll to listen to this audio lesson

Next, let's discuss income stratification within countries, particularly focusing on the Gini coefficient. Can someone tell me what a Gini coefficient represents?

It's a measure of income inequality within a nation, right?
Great! Gini coefficients can range from 0 to 1, with 0 indicating perfect equality. What have we learned about industrial towns like Manchester in the 1840s?
They had Gini indices of about 0.55 to 0.60, meaning income was highly concentrated among a few.
Right! This reflects significant disparities between mill owners and laborers. Can anyone discuss labor conditions during this time?
Child labor was prevalent, with very long working hours.
Exactly! Such working conditions led to social reforms. What did these reforms aim to address?
They aimed to regulate labor hours and protect children from exploitation.
Very insightful! The socio-economic implications of these practices are still relevant.
Environmental and Social Externalities
🔒 Unlock Audio Lesson
Sign up and enroll to listen to this audio lesson
Lastly, let's discuss the environmental and social externalities of the growing economies. What do you think happened to CO₂ levels during industrial growth?
They likely increased due to coal consumption.
Absolutely! From 1750 to 1850, atmospheric CO₂ levels rose from 280 ppm to 290 ppm. What kinds of social disruptions accompanied these environmental changes?
Displacement of farmers and increased urban migration?
Exactly! Enclosures and clearances pushed people into cities, impacting social structures. Why is understanding these disruptions vital?
Because they show how economic policies can adversely affect society.
Great point! The interplay between economics and society is crucial for understanding today's issues.
Introduction & Overview
Read summaries of the section's main ideas at different levels of detail.
Quick Overview
Standard
The section examines various indicators of economic inequality, including per-capita GDP estimates from different nations and the Gini coefficient reflecting within-country income stratification. It discusses how historical trade activities and labor conditions contributed to disparities in wealth distribution.
Detailed
Cross‐National Income Gaps
This section delves into the economic disparities between nations, particularly focusing on per-capita GDP, which serves as a key measure of income levels. Using estimates from Maddison (2001), Britain in 1800 is noted to have a per-capita GDP of $1,100 (in 1990 Geary–Khamis dollars), while India and Qing China were significantly lower at $550 and $600 respectively. These figures highlight the early stages of the 'Great Divergence', a term that refers to the growing economic gap between Western Europe and parts of the East.
Key Points
- Per-Capita GDP Estimates: In 1800, Britain outpaced both India and Qing China, emphasizing the divergent economic paths taken by nations.
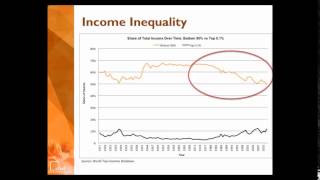
- Within-Country Stratification: The section further addresses income inequality within countries, illustrated by Gini coefficients from industrial towns in England, such as Manchester in the 1840s, showing indices around 0.55 to 0.60. This indicates a high level of income concentration among mill owners compared to wage laborers.
- Labor Conditions: Child labor practices and exhaustive working hours, documented by factory inspectors, underline the societal implications of these economic conditions, leading to regulatory measures through Factory Acts.
- Environmental and Social Externalities: The historical context of coal consumption reveals a rise in atmospheric CO₂ levels, linked to industrial activities, causing long-term environmental impacts and cultural disruptions like peasant displacement due to land enclosures.
Understanding these elements provides a clearer view of how cross-national income gaps developed and the various factors that contributed to ongoing disparities in wealth.
Youtube Videos


Audio Book
Dive deep into the subject with an immersive audiobook experience.
Per‐Capita GDP Estimates
Chapter 1 of 3
🔒 Unlock Audio Chapter
Sign up and enroll to access the full audio experience
Chapter Content
● Per‐Capita GDP Estimates (Maddison, 2001):
○ Britain: $1,100 (1990 Geary–Khamis dollars) in 1800.
○ India: $550; Qing China: $600—illustrating the nascent ‘Great Divergence.’
Detailed Explanation
This chunk presents a comparison of per-capita GDP in different countries in the year 1800. Per-capita GDP is a way to measure the average economic output per person, giving an insight into living standards. For instance, Britain's GDP per person was $1,100, which was significantly higher than India's at $550 and China's at $600. This highlights a developing economic gap, known as the 'Great Divergence,' where some countries began to experience greater wealth compared to others.
Examples & Analogies
Think of it like a class of students where some have very high test scores while others score much lower. If one student (Britain) consistently scores 100 points on tests while others (India and China) score only 50 or 60, we can see a growing gap in performance, just like the income gaps between these countries.
Within‐Country Stratification
Chapter 2 of 3
🔒 Unlock Audio Chapter
Sign up and enroll to access the full audio experience
Chapter Content
● Gini Coefficients:
○ Early industrial towns (Manchester, 1840s) recorded Gini indices of 0.55–0.60, reflecting high income concentration among mill owners versus wage laborers.
● Labour Conditions:
○ Factory inspectors in England (1833) reported child laborers as young as 5 working 14‑hour days; subsequent Factory Acts (1833, 1844) began to regulate hours and age.
Detailed Explanation
This chunk discusses income inequality within countries, specifically looking at Manchester in the 1840s through the lens of the Gini coefficient, which measures income distribution. A Gini index between 0 (perfect equality) and 1 (maximum inequality) shows that this town had a high level of income inequality, with mill owners earning significantly more than workers. Additionally, it highlights poor labor conditions, revealing that children as young as five were working excessively long hours, indicating that social reforms were necessary to protect workers’ rights.
Examples & Analogies
Imagine a soccer team where the coach receives a massive salary while the players earn very little; the team members might become dissatisfied and overworked. Similarly, in Manchester, the mill owners had much more wealth while their workers, including children, were burdened with long hours and low pay, prompting a need for laws to protect their well-being.
Environmental and Social Externalities
Chapter 3 of 3
🔒 Unlock Audio Chapter
Sign up and enroll to access the full audio experience
Chapter Content
● Carbon Footprint Continuities:
○ Historical coal consumption contributed to pre‐industrial atmospheric CO₂ levels rising from 280 ppm (1750) to 290 ppm (1850), a 3.6% increase.
● Cultural Disruption:
○ Enclosures in England and Clearances in Scotland (18th–19th centuries) displaced peasant farmers, prompting internal migration to industrial centers and emigration to colonies.
Detailed Explanation
This chunk highlights the environmental impact of historical economic practices and the social consequences of industrialization. It mentions that the use of coal increased CO₂ levels in the atmosphere, which contributes to climate change. Additionally, it points out how land enclosures in England and Clearances in Scotland forced many farmers off their land, pushing them into cities for work, which altered social structures and lifestyles. This illustrates that economic changes can have far-reaching effects on both the environment and society.
Examples & Analogies
Think of it like a small village where all the farmers are suddenly told they can no longer use the land they’ve farmed for generations. They must move to the city for jobs, leading to crowded urban areas and environmental issues. Similarly, the changes brought by industrialization in England and Scotland disrupted communities and increased pollution due to the reliance on coal.
Key Concepts
-
Per-Capita GDP: A significant measure reflecting a country's economic performance per person.
-
Great Divergence: The widening economic gap between nations, particularly between the West and the East.
-
Gini Coefficient: A crucial tool for measuring income inequality within nations.
-
Environmental Externalities: The unintended impacts of economic activities on environmental conditions.
-
Child Labor: A significant issue tied to industrial growth and economic practices.
Examples & Applications
Example of per-capita GDP disparity between Britain, India, and Qing China in 1800.
The use of Gini coefficients to illustrate income inequality in Manchester's industrial workforce.
Memory Aids
Interactive tools to help you remember key concepts
Rhymes
Britain led the GDP race, with numbers high, it set the pace. India and China lagged behind, their wealth in history hard to find.
Stories
Once upon a time, there were three kingdoms: Britain, India, and Qing China. Britain built factories and traded widely, growing rich, while India and China struggled, starting the tale of the Great Divergence.
Memory Tools
Gems - Gini, Environment, Migration, Society represent the key themes of our study.
Acronyms
GEM - Gini coefficient, Economic disparity, Migration impacts.
Flash Cards
Glossary
- PerCapita GDP
A measure of a country's economic output that accounts for its number of people.
- Great Divergence
The term used to describe the widening gap in wealth between Western Europe and parts of the East, primarily during the Industrial Revolution.
- Gini Coefficient
A statistical measure of income inequality within a population, where 0 represents perfect equality and 1 represents maximum inequality.
- Environmental Externalities
Unintended side effects of economic activities that impact the environment, often not reflected in market prices.
- Child Labor
The practice of employing children in work that deprives them of their childhood, potential, and dignity.
Reference links
Supplementary resources to enhance your learning experience.