
Linear Regression
Enroll to start learning
You’ve not yet enrolled in this course. Please enroll for free to listen to audio lessons, classroom podcasts and take practice test.
Interactive Audio Lesson
Listen to a student-teacher conversation explaining the topic in a relatable way.
Introduction to Linear Regression
🔒 Unlock Audio Lesson
Sign up and enroll to listen to this audio lesson

Welcome class! today we'll learn about linear regression, a method that helps us predict one variable based on another. Can anyone share what they think regression might involve?

Is it about finding a relationship between two things?
Exactly! Linear regression studies the linear relationship between variables. We have our independent variable, which we denote as x, and our dependent variable, y. Why do you think it's important to distinguish these two?

Because we need to know which one we use to make predictions.
Right! x is what you control, and y is what you predict. Let’s remember this with the acronym C-P: Control for x, Predict for y. Let's move on!
Regression Lines Explained
🔒 Unlock Audio Lesson
Sign up and enroll to listen to this audio lesson

Now, there are two regression lines to be aware of. Can anyone name them?

One is for predicting y from x, and the other is the opposite!
Correct! We have the regression line of y on x and the regression line of x on y. They serve different purposes and are only equal if there's a perfect correlation. What do you think 'perfect correlation' means?

It means every change in x results in a change in y, right?
Exactly! Let's remember 'Perfect Correlation = Perfect Fit' to keep this in mind!
Understanding Regression Coefficients
🔒 Unlock Audio Lesson
Sign up and enroll to listen to this audio lesson
Next, let's talk about regression coefficients. Why do you think we need them?
To quantify the relationship between x and y?
Yes! They are critical for formulating the regression equations. This is where we use Pearson's correlation coefficient and standard deviations. Does anyone recall what r represents?
It’s the correlation coefficient, showing how well x and y are related!
Great! To help memorize these calculations, think of 'S-C-R-E-W': Standard deviations, Coefficient, Relation, Equation, and We can predict!
Putting It All Together - Regression Equations
🔒 Unlock Audio Lesson
Sign up and enroll to listen to this audio lesson
Finally, let's apply what we've learned by walking through the steps of creating a regression equation. Can anyone summarize the steps?
We calculate means, standard deviations, find r, compute coefficients, and then write the equations!
Exactly! Each of these steps is crucial. Remember to keep in mind the acronym M-S-R-C-E: Means, Standard deviations, Regression, Coefficients, Equations. Any questions before we do an example?
How do we use these equations to make predictions?
Good question! Once we have the regression equation, we can substitute values of x to find the corresponding y. Let’s see that in our example next!
Introduction & Overview
Read summaries of the section's main ideas at different levels of detail.
Quick Overview
Standard
This section introduces linear regression, covering its foundational concepts such as the independent and dependent variables, regression lines, and key formulae. The chapter also details a step-by-step method for performing linear regression, including calculating means, standard deviations, and regression coefficients, illustrated with examples.
Detailed
Detailed Summary
Linear regression is vital for real-life data analysis, allowing the prediction of one variable based on another by establishing a linear relationship between them. This section begins with defining the basic terms involved in regression analysis:
- Independent variable (x): The variable that is used for prediction.
- Dependent variable (y): The outcome variable that we seek to predict.
Two primary regression lines are introduced:
- The regression line of y on x predicts the value of y based on x.
- The regression line of x on y does the reverse.
Additionally, the relationships are described mathematically using regression coefficients, which are calculated using Pearson's correlation coefficient and the standard deviations of the respective variables. The section further presents a systematic five-step procedure for conducting linear regression analysis:
1. Calculating the means of x and y.
2. Determining the standard deviations of x and y.
3. Finding the correlation coefficient (r).
4. Calculating the regression coefficients.
5. Formulating the regression equations based on the derived coefficients.
An example is used to clarify these concepts, and important notes highlight that the regression lines intersect at the mean points of the variables and when r equals zero, indicating no linear relationship. Finally, applications of linear regression span various fields, including economics, education, and sciences, to make informed predictions and analyses.
Correlation Coefficient (r)
The strength of the linear relationship between two variables is measured by the correlation coefficient \(r\). Its formula is:
\[
r = \frac{\text{Cov}(x,y)}{\sigma_x \sigma_y}
\]
where \(\text{Cov}(x,y)\) is the covariance between \(x\) and \(y\), and \(\sigma_x, \sigma_y\) are the standard deviations of \(x\) and \(y\).
Youtube Videos
Audio Book
Dive deep into the subject with an immersive audiobook experience.
Introduction to Linear Regression
Chapter 1 of 1
🔒 Unlock Audio Chapter
Sign up and enroll to access the full audio experience
Chapter Content
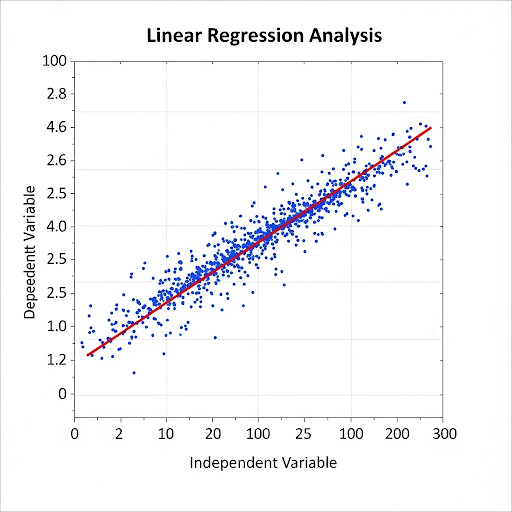
In real-life data analysis, it is often necessary to predict or estimate one quantity based on another. For example, estimating the marks of a student based on the number of hours they study. This predictive technique forms the basis of regression analysis. In Linear Regression, we study the linear relationship between two variables. If the relationship is strong, we can estimate the value of one variable from the value of the other using a line of best fit.
Detailed Explanation
Linear regression is a mathematical approach used to understand the relationship between two variables by fitting a linear equation to the observed data. The independent variable (often denoted as x) is what you use to predict, while the dependent variable (y) is what you are trying to estimate. This relationship can be represented visually with a line of best fit.
Examples & Analogies
Imagine you want to predict how much ice cream a shop will sell based on the temperature outside. As the temperature rises, ice cream sales usually increase. By using the previous sales data, you can create a line of best fit that helps predict how many ice creams you might sell on a sunny day.
Key Concepts
-
Independent Variables (x): Variables used for making predictions.
-
Dependent Variables (y): Outcomes that we aim to predict using independent variables.
-
Regression Line: A visual representation of the predicted values of y for given values of x.
-
Pearson's Correlation Coefficient: A statistical measure that summarizes how two variables relate to one another.
-
Regression Coefficients: Values that represent the strength of the relationship between the independent and dependent variable.
Examples & Applications
Example: Given the data points (2,5), (4,7), (6,9), and (8,10), the steps to calculate the regression equation of y on x would be outlined, resulting in the equation y = 0.981x + 2.845, which predicts y based on x.
Example: If x = 5 hours of study, we would use the regression equation found topredicted marks y = 0.981(5) + 2.845 = 7.8.
Memory Aids
Interactive tools to help you remember key concepts
Rhymes
To predict and confess, regression's the best. X gives the try, while Y aims high!
Stories
Imagine a student who studies diligently, they keep studying longer hours and inevitably score higher grades, this is how y wants to get influenced by x.
Memory Tools
Remember M-S-R-C-E: Means, Standard deviations, Regression, Coefficients, Equations for a smooth regression procedure.
Acronyms
Use C-P
Control for (x)
Predict for (y) to remember the roles of the independent and dependent variables.
Flash Cards
Glossary
- Independent Variable
The variable manipulated to predict outcomes in regression analysis (denoted as x).
- Dependent Variable
The outcome variable in regression analysis that is being predicted (denoted as y).
- Regression Line
A line that best fits the data points in regression analysis, showing the relationship between variables.
- Pearson's Correlation Coefficient
A measure of the strength and direction of association between two continuous variables.
- Standard Deviation
A statistic that quantifies the amount of variation or dispersion in a set of values.
- Regression Coefficient
A numerical value that indicates how much the dependent variable changes in response to a change in the independent variable.
- Equation of Regression Line
Mathematical representation of the relationship between independent and dependent variables, typically in the form y = mx + b.