
Predicting the Response of Sensors to Various Inputs
Enroll to start learning
You’ve not yet enrolled in this course. Please enroll for free to listen to audio lessons, classroom podcasts and take practice test.
Interactive Audio Lesson
Listen to a student-teacher conversation explaining the topic in a relatable way.
Sensor Response Characteristics
🔒 Unlock Audio Lesson
Sign up and enroll to listen to this audio lesson

Today, we will discuss how various sensors respond to multiple types of physical inputs. Can anyone tell me what kind of inputs sensors may measure?

They measure things like strain and temperature, right?
Exactly! Sensors respond to physical inputs such as strain, temperature, and displacement. Understanding these characteristics is crucial for effective sensor selection.

What happens if a sensor is used outside its range?
Great question! Exceeding the sensor's operating range can lead to nonlinear outputs, saturation, or even damage. This is why it's important to understand linearity.

How do we ensure the sensor gives accurate readings?
Calibration plays a key role here. It involves using calibration curves that relate the sensor output to physical units. Remember, accuracy is key!

What about the environmental factors that affect sensors?
Absolutely! Temperature changes, electromagnetic interference, and the conditions under which the sensor is mounted can greatly impact the readings.
To summarize, understanding sensor response characteristics helps us choose the right sensor and ensure precise measurements.
Linearity and Range of Sensors
🔒 Unlock Audio Lesson
Sign up and enroll to listen to this audio lesson

Next, let’s talk more about linearity and range. Why do you think it's essential for a sensor to have a defined linear range?
Because if we know the range, we can avoid using it in conditions that could break it?
That's right! Operating within a defined linear range ensures that the output remains proportional to the input, providing reliable data.
What happens if we go beyond that range?
Exceeding the range may cause nonlinear behavior, where the response no longer correlates with the input—leading to inaccuracies.
So, how do we know the linear range of a sensor?
This is typically given by the manufacturer or derived from calibration testing. Always check specifications before use!
In summary, knowing the linear range ensures we can use sensors effectively without risk of damaging them or retrieving inaccurate data.
Signal Conditioning and Calibration
🔒 Unlock Audio Lesson
Sign up and enroll to listen to this audio lesson
Now let’s dive into signal conditioning. Can anyone explain what that involves?
Isn’t it about processing the raw data from sensors?
Exactly! Signal conditioning includes functions such as amplification, filtering, and conversion to ensure the data is usable.
And what about calibration?
Calibration is crucial for ensuring accuracy. It matches the raw output to standard physical quantities, allowing for reliable measurements.
How do we create a calibration curve?
Calibration curves are constructed using empirical data or manufacturer's specifications, typically plotted against known values.
In summary, signal conditioning and calibration help us derive accurate and meaningful data from sensors, a must in engineering applications.
Environmental Factors Affecting Sensor Performance
🔒 Unlock Audio Lesson
Sign up and enroll to listen to this audio lesson
Finally, let's discuss environmental factors. Why are these significant when deploying sensors?
Because they could change how the sensor measures things, right?
Absolutely! Environmental factors like temperature fluctuations and electromagnetic interference can adversely affect sensor performance.
What can we do to mitigate these effects?
Choosing robust sensors designed for specific environments or planning installations that minimize exposure can help reduce these effects.
So we need to consider the environment before installing a sensor?
Correct! The installation conditions and site characteristics are crucial for ensuring accurate readings.
In summary, understanding and mitigating environmental influences are vital for reliable sensor operation in monitoring programs.
Introduction & Overview
Read summaries of the section's main ideas at different levels of detail.
Quick Overview
Standard
The section delves into the response characteristics of different sensors, the importance of linearity, dynamic and static responses, signal conditioning, environmental impacts, and calibration processes. Understanding these concepts is crucial for effectively deploying sensors in monitoring civil engineering applications.
Detailed
Predicting the Response of Sensors to Various Inputs
This section explores the fundamental behaviors of sensors in response to various physical inputs, including strain, temperature, displacement, and acceleration.
Key Characteristics of Sensors
- Sensor Response Characteristics: It’s essential to grasp how different types of sensors react to various physical phenomena to select the appropriate sensor for specific applications.
- Linearity and Range: Most sensors operate within a specific linear region where output is directly proportional to the input. Understanding the limits of this range is crucial, as exceeding it may lead to nonlinearity or sensor damage.
- Dynamic vs Static Response: Differentiating between static sensors, which deal with constant inputs, and dynamic sensors, which track variations over time, is significant for applications like monitoring vibrations.
- Signal Conditioning: Raw signals from sensors often need processing—in many cases, amplification or filtering—for accurate readings. Examples include the usage of Wheatstone bridges for strain gauges.
- Calibration Curves: Calibration is vital; it involves creating curves derived from empirical data or manufacturer specifications to translate raw outputs into meaningful physical units.
- Environmental Factors: External conditions, such as temperature fluctuations or electromagnetic interference, may alter sensor performance, requiring careful consideration during deployment.
These topics are interlinked with construction and operational practices within civil engineering, where monitoring changes in structures like bridges and buildings is paramount for safety and performance.
Youtube Videos


Audio Book
Dive deep into the subject with an immersive audiobook experience.
Sensor Response Characteristics
Chapter 1 of 6
🔒 Unlock Audio Chapter
Sign up and enroll to access the full audio experience
Chapter Content
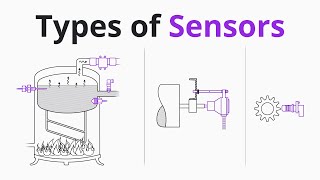
Understand how different sensor types respond to physical inputs like strain, temperature, displacement, or acceleration.
Detailed Explanation
This chunk discusses how various types of sensors react to different physical phenomena. Sensors are designed to measure specific inputs such as strain (deformation), temperature (heat), displacement (movement), or acceleration (change in speed). Each type of sensor has its unique way of capturing and converting these inputs into readable data. Understanding these characteristics is crucial for selecting the right sensor for a specific application.
Examples & Analogies
Think of a thermometer as a sensor that measures temperature. Just like a thermometer senses temperature changes in the environment, other sensors respond to their specific conditions. For instance, a strain gauge measures how much a bridge deforms under the weight of cars.
Linearity and Range
Chapter 2 of 6
🔒 Unlock Audio Chapter
Sign up and enroll to access the full audio experience
Chapter Content
Most sensors have an operating range within which output is proportional to input (linear region). Beyond this, nonlinear behavior, saturation, or damage can occur.
Detailed Explanation
Linearity refers to how well the sensor output corresponds to the input across a specific range. In the linear region, if you increase the input, the output increases proportionally. However, if you exceed this range, the sensor may not function correctly and can experience nonlinear behavior or saturation where it can no longer accurately measure changes. This is important when detecting small versus large inputs as it can affect overall readings.
Examples & Analogies
Imagine using a rubber band to measure how much weight you can lift. If you only use a small weight, the rubber band stretches proportionally. But if you try to lift something too heavy, it might snap or not stretch accurately anymore. The rubber band represents the sensor, and the weight is the input.
Dynamic vs Static Response
Chapter 3 of 6
🔒 Unlock Audio Chapter
Sign up and enroll to access the full audio experience
Chapter Content
Static sensors measure steady-state inputs (e.g., a strain gauge under constant load). Dynamic sensors respond to time-varying signals (e.g., accelerometers monitoring vibrations).
Detailed Explanation
In this chunk, we learn about the two types of sensor responses: static and dynamic. Static sensors, for example, are used for measuring constant values that do not change quickly, like the load on a beam. Dynamic sensors, conversely, can capture rapid changes, such as vibrations from an earthquake. Choosing between them depends on the kind of data needed and the conditions being measured.
Examples & Analogies
Consider a stop light (static) versus a speed bump (dynamic). The stop light is like a static sensor measuring fixed states, while the speed bump reacts to the rapid changes of cars passing over it like a dynamic sensor measuring quick vibrations.
Signal Conditioning
Chapter 4 of 6
🔒 Unlock Audio Chapter
Sign up and enroll to access the full audio experience
Chapter Content
Sensors produce raw analog signals which may require amplification, filtering, or conversion (e.g., Wheatstone bridge for strain gauges).
Detailed Explanation
Raw signals output from sensors often need processing to obtain usable data. Signal conditioning is the process where these raw analog signals are amplified, filtered, or converted to ensure accurate readings. For instance, strain gauges generate very weak signals that need amplification to be usable. This step is fundamental to ensure the sensors provide reliable data.
Examples & Analogies
Think of a whispered conversation (raw signal). It's hard to hear the details without amplification. A microphone amplifies this sound so everyone can hear it clearly, just like signal conditioning ensures clear, usable data from sensors.
Calibration Curves
Chapter 5 of 6
🔒 Unlock Audio Chapter
Sign up and enroll to access the full audio experience
Chapter Content
Empirical or manufacturer-provided data helping map sensor output to physical units.
Detailed Explanation
Calibration curves refer to the relationship between the sensor's output and the physical measurement it is supposed to represent. These curves can be derived from empirical data or supplied by the manufacturer. They are essential for converting the sensor's readings into meaningful physical units, ensuring high accuracy in measurements.
Examples & Analogies
Imagine using a baking scale. When calibrating the scale, you need to weigh a known mass (like a bag of flour) to ensure it reads accurately. Similarly, calibration curves help ensure sensors provide correct measurements.
Environmental Factors
Chapter 6 of 6
🔒 Unlock Audio Chapter
Sign up and enroll to access the full audio experience
Chapter Content
Temperature fluctuations, electromagnetic interference, and mounting conditions can alter sensor response.
Detailed Explanation
Environmental factors can significantly impact sensor performance. For example, changes in temperature can alter the materials of sensors, affecting accuracy. Electromagnetic interference can disrupt sensor signals, leading to incorrect readings. Likewise, how and where a sensor is mounted can influence its response. Understanding and mitigating these factors is crucial for reliable sensor operation.
Examples & Analogies
Consider trying to tune a guitar in a noisy environment. Just as background noise can make it hard to hear the specific note, environmental factors can interfere with a sensor's ability to provide accurate readings.
Key Concepts
-
Sensor Response Characteristics: The behavior of sensors in response to various physical inputs.
-
Linearity: The relationship between the input and output of a sensor within its operating range.
-
Dynamic vs Static Response: The difference between sensors that measure constant inputs and those that monitor changing signals.
-
Signal Conditioning: The processes applied to sensor outputs to prepare them for effective data interpretation.
-
Calibration Curves: Graphs that correlate the output of sensors to specific physical measurements.
-
Environmental Factors: External conditions like temperature and electromagnetic fields that can affect sensor readings.
Examples & Applications
A strain gauge measuring deformation in a bridge under load demonstrates static response characteristics, while an accelerometer measures vibrations in real-time, representing dynamic response.
Signal conditioning through amplification is used in scenarios where sensor outputs are weak and need strengthening for accurate readings.
Memory Aids
Interactive tools to help you remember key concepts
Rhymes
To measure well, sensors we must tell, the range and conditions, they know so well.
Stories
Imagine a bridge that sways and creaks; a sensor checks for strains each day it peaks. With careful adjustments, it stays in its zone; calibration ensures the data is known.
Memory Tools
Remember the acronym SLICE for the key concepts: S for Sensor characteristics, L for Linearity, I for Inputs, C for Calibration, and E for Environment.
Acronyms
For the sensor deployment check, think LINE - L for Limitations, I for Installation, N for Noise reduction, E for Environment!
Flash Cards
Glossary
- Sensor Response Characteristics
Behavior of sensors in reaction to various physical inputs like strain, temperature, and acceleration.
- Linearity
The property of a sensor's output being proportional to its input within a defined range.
- Static Sensors
Sensors that measure steady-state inputs.
- Dynamic Sensors
Sensors that respond to time-varying signals or conditions.
- Signal Conditioning
The process of preparing sensor output for accurate interpretation, including amplification and filtering.
- Calibration Curves
Graphs that relate sensor output to known physical quantities for accurate readings.
- Environmental Factors
External conditions that can influence sensor performance, including temperature and electromagnetic interference.
Reference links
Supplementary resources to enhance your learning experience.