
Contouring
Enroll to start learning
You’ve not yet enrolled in this course. Please enroll for free to listen to audio lessons, classroom podcasts and take practice test.
Interactive Audio Lesson
Listen to a student-teacher conversation explaining the topic in a relatable way.
Introduction to Contouring
🔒 Unlock Audio Lesson
Sign up and enroll to listen to this audio lesson

Today, we are going to explore the concept of contouring. Contour lines are imaginary lines drawn on maps that connect points of equal elevation. Can anyone tell me why this is important?

I think it helps to visualize the terrain when looking at a flat map.
Exactly! By using contour lines, we can represent the 3D shape of the land on a 2D surface. Can you imagine how a mountain or valley would look with contour lines on a map?

I can picture it! The lines would be close together for steep areas and further apart for flat regions.
That's right! The spacing of these lines tells us about the steepness of slopes. Let's remember that as we learn more about contouring!
Contour Intervals
🔒 Unlock Audio Lesson
Sign up and enroll to listen to this audio lesson

Now, let's discuss contour intervals. The contour interval is the vertical distance between consecutive contour lines. Why do you think it's important to choose the right contour interval?

If it's too big, important details might get missed, and if it's too small, the map might get cluttered.
Exactly! The ideal contour interval depends on several factors, including the nature of the terrain and the purpose of the map. To help remember, we could think of the acronym 'NPSP': Nature, Purpose, Scale, and People’s time/resources. Can anyone elaborate on that?

Nature refers to the type of land, whether it's flat or hilly, and scale deals with how detailed the map is.
Great explanation! Now, how about some real-world applications where choosing the right interval can affect engineering projects?
Characteristics of Contour Lines
🔒 Unlock Audio Lesson
Sign up and enroll to listen to this audio lesson
Let's dive into the characteristics of contour lines. Can someone identify what concentric contours might indicate?
They could indicate a hill or a depression depending on if the values are increasing or decreasing.
Excellent! Increasing values indicate a hill, while decreasing values suggest a depression. Remember this as a key point. Now, can anyone think of situations where these characteristics would be useful?
In construction, knowing if an area is a hill or depression could influence where to build or how to manage drainage.
Precisely! Understanding these characteristics helps in planning and decision making. Let’s continue to build on these ideas.
Using Contour Maps
🔒 Unlock Audio Lesson
Sign up and enroll to listen to this audio lesson
Today, we'll cover the uses of contour maps. What are some applications you think contour maps can serve in engineering?
They can help determine the best route for a road or identify suitable construction sites.
That's exactly right! Contour maps make it possible to plan effectively for construction and environmental management. Remember the acronym 'SCORE': Site selection, Cross-sections, Optimal routes, Reservoir capacity, and Earthwork balance. Can anyone relate this to a real example?
Building a new highway on hilly terrain would need careful consideration of the slopes and dips shown in the contour map.
Great job! The role of contour maps cannot be overstated in planning and executing successful engineering projects.
Surveying Methods
🔒 Unlock Audio Lesson
Sign up and enroll to listen to this audio lesson
Finally, let's look at how we gather the data for these contour maps. There are two main methods: direct and indirect. Can anyone explain one of these methods?
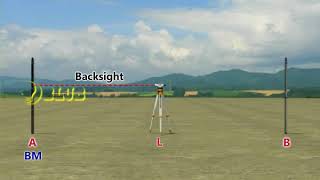
In the direct method, you use a leveling instrument to find the elevation of points along a contour line.
Exactly! It's accurate but can be slow. Now, what about the indirect method?
In the indirect method, you take spot levels and interpolate them to draw contour lines.
Wonderful! Each method has its pros and cons depending on the area and project requirements. Let's remember that as we proceed!
Introduction & Overview
Read summaries of the section's main ideas at different levels of detail.
Quick Overview
Standard
Contouring is vital in mapping terrain, as it helps represent elevations through contour lines. The section covers contour intervals, characteristics of contour lines, their uses, surveying methods, digital elevation models (DEMs), and how to compute areas and volumes in engineering projects.
Detailed
Detailed Summary
Contouring, as described in this section, is the process of representing three-dimensional surfaces on two-dimensional maps through the use of contour lines. These lines connect points of equal elevation and provide valuable information on the topography of the land. The distinctive features of contour lines include their characteristics, such as depicting hills or depressions, and their spacing indicates the steepness of slopes.
Key points discussed include:
- Contour Interval: This is the vertical distance between successive contours. Its selection is influenced by the map scale, the purpose of the map, the nature of the ground, and the availability of time and funds for the survey.
- Characteristics of Contour Lines: Different patterns in contour lines indicate specific geological features, like hills, valleys, and ridges. They also signal the slope's steepness, which is crucial for construction and land use planning.
- Uses of a Contour Map: Contour maps inform engineering decisions, such as site selection, design of transportation routes, capacity estimation of reservoirs, and land use planning.
- Methods of Surveying: Two primary approaches are discussed: direct and indirect methods for generating contours using leveling instruments and interpolation techniques.
- Digital Elevation Models (DEMs): This modern technique replaces traditional mapping and enables a detailed and accurate representation of terrain data for various applications.
- Area and Volume Computations: Techniques for calculating land area and material volumes using methods like the Trapezoidal and Prismoidal rules are included, highlighting the relevance of these computations for engineering projects.
Overall, understanding contouring is essential for effectively interpreting and utilizing maps in environmental, civil engineering, and urban planning contexts.
Youtube Videos


Audio Book
Dive deep into the subject with an immersive audiobook experience.
Overview of Contouring
Chapter 1 of 6
🔒 Unlock Audio Chapter
Sign up and enroll to access the full audio experience
Chapter Content
A map represents 3D Earth surface onto 2D paper. While, the planimetric position of any object/feature is depicted by their latitude and longitude, the third dimension (i.e., elevations) on the maps are represented by the contours. Contour line is an imaginary line on a map, drawn through the points of equal elevation. In addition, there might be few BMs present on the maps whose elevations are known. The elevations of various objects/features can be obtained by levelling, and the spot levels of well distributed points to provide a fair representation of minimum and maximum elevations in the area.
Detailed Explanation
Contour lines are essential for displaying the elevation of terrain on a two-dimensional map. Maps typically show two dimensions, latitude, and longitude, allowing us to pinpoint where features are located, but they lack a third dimension, elevation. Contour lines fill that gap by connecting points of equal elevation on the map. These lines help visualize the terrain's shape and slope. For example, if you look at a map of a mountainous area, the contour lines will indicate higher and lower elevations, guiding the viewer's understanding of the landscape’s features.
Examples & Analogies
Think of contour lines like the lines of a topographical cake. If you were to slice a cake into horizontal layers, each layer would represent a different height of cake, similar to how contour lines represent different elevations on a map. Just as you can see the different levels of the cake, contour lines show us the high and low points of the land.
Contour Interval
Chapter 2 of 6
🔒 Unlock Audio Chapter
Sign up and enroll to access the full audio experience
Chapter Content
The constant vertical distance between the successive contours is called the contour interval. Smaller the contour interval, greater will be the fieldwork to collect the elevation data. A contour interval sufficient to show features in a hilly region would be insufficient in flat regions. A contour interval for an area/project depends upon several factors, such as the nature of ground, the purpose and extent of survey, the scale of mapping, and the time & funds available.
Detailed Explanation
The contour interval is the difference in elevation between two adjacent contour lines. A smaller contour interval means more lines and more detailed elevation information, requiring more work to collect and map data. The choice of contour interval is influenced by the landscape itself (flat or hilly), what the map is being used for, the size of the map, and the resources available. For instance, in steep areas, broader contour intervals may adequately convey the terrain’s features, while flat areas might need narrower intervals to capture subtle changes.
Examples & Analogies
Imagine you’re trying to describe a hill's height. If the hill is steep, you might just say it has a height of 100 meters. But if it’s mostly flat, describing small rises and dips might require a more detailed approach, like stating every single centimeter. Similarly, in mapping, using a small contour interval in flat areas captures those subtle changes in elevation that larger intervals would miss.
Factors Deciding the Contour Interval
Chapter 3 of 6
🔒 Unlock Audio Chapter
Sign up and enroll to access the full audio experience
Chapter Content
Contour interval on a map is decided by the following factors: (a) Scale of the map: The contour interval is kept inversely proportional to the scale of the map. Smaller the scale of map, larger the contour interval. On the other hand, if the scale of the map is large, the contour interval should be small. (b) Purpose of the map: The contour interval also depends upon the purpose for which the map is to be utilised. (c) Nature of the ground: The contour interval depends upon the general topography of the terrain. (d) Availability of time and funds: If the time available is less, greater contour interval is selected to complete the project in the given time.
Detailed Explanation
Several factors determine the contour interval of a map. First, the map's scale plays a major role; larger scale maps show more detail, necessitating smaller contour intervals, while smaller scale maps may use larger intervals. Secondly, the intended use of the map influences the contour interval — technical projects may require precise details, while simpler maps might not need fine detail. The nature of the terrain also matters; hilly areas might require broader intervals while flat terrains need finer divisions. Lastly, if resources like time and money are limited, broader intervals may be preferred to expedite the work.
Examples & Analogies
Consider riding a bike in two different parks: one with tall hills and the other flat. In the hilly park, you notice the steepness and need to know even small elevation changes to navigate safely, requiring detailed maps with small contour intervals. In the flat park, the path is pretty level, and a less detailed map using larger contour intervals is sufficient. Thus, where you are and what you need affects what kind of map you’ll use!
Characteristics of Contour Lines
Chapter 4 of 6
🔒 Unlock Audio Chapter
Sign up and enroll to access the full audio experience
Chapter Content
- Concentric closed contours with decreasing values towards centre indicate a pond or depression. 2. Concentric closed contours with increasing values towards centre indicate a hill. 3. Contour lines with the concavity (inverted V-shape) towards the higher ground indicate a ridge. 4. Contour lines cross with convexity (V-shape) towards the higher ground indicates a valley.
Detailed Explanation
Contour lines have specific characteristics that reveal information about the terrain. Closed contours with decreasing elevation values indicate depressions, like ponds. Conversely, closed contours with increasing values point to hills. The shape and orientation of the contours also show terrain features — an inverted V shape generally indicates a ridge, while a V shape suggests a valley. These characteristics help map readers understand the topography at a glance without needing extensive description.
Examples & Analogies
Think of contour lines as the rings in a tree trunk. Each ring represents a year of growth; similarly, contour lines represent different heights. If you cut through and see wider rings converging where it’s softer (like a pond), that indicates a depression. Conversely, narrow rings that rise towards the center tell us that part of the tree is thicker and thus higher, representing a hill in contour mapping.
Uses of a Contour Map
Chapter 5 of 6
🔒 Unlock Audio Chapter
Sign up and enroll to access the full audio experience
Chapter Content
Maps with contours on them are extremely useful for various engineering projects, as listed below: 1. Contours are most often used to depict the relief. 2. Profiles of the ground along a line and its cross-section can be drawn using contours. 3. The optimum route of the railway, road, canal, pipeline or sewer line can be decided which can minimize the earthwork. 4. Intervisibility between any two points can be ascertained from the longitudinal profile of the ground.
Detailed Explanation
Contour maps are vital in engineering and planning. They depict the land's relief, which helps in site selection for projects. Ground profiles help in visualizing what construction will involve, estimating earthwork, and determining optimal routes for infrastructure projects like roads, railways, and pipelines. Additionally, contour maps can assess the visibility between points, which is crucial in locations such as airports and areas needing clear sight lines.
Examples & Analogies
Think of a contour map as a guide for a treasure hunt in a hilly area. The map’s contours show where the steep hills and valleys are, helping you choose the easiest path—avoiding the steep climbs whenever possible. Just like choosing the best path to find your treasure quickly, engineers use contour maps to design efficient roads or pipelines.
Methods of Contouring
Chapter 6 of 6
🔒 Unlock Audio Chapter
Sign up and enroll to access the full audio experience
Chapter Content
There are two main methods of surveying: (a) Direct method- This method finds the elevation of points in the area which lie on the selected contour line. (b) Indirect methods- Here, RLs of some selected points (also known as spot levels) are taken. The contour lines are interpolated using the RLs of these selected points.
Detailed Explanation
Contouring can be done through direct and indirect methods. The direct method involves physically measuring the elevation at specific points along a contour line using leveling instruments. It’s accurate but can be slow. The indirect method relies on known elevation points to estimate contours, which is faster and can cover larger areas but may be less precise. Surveyors choose based on project requirements, available time, and the terrain itself.
Examples & Analogies
Consider a school project of mapping your playground. The direct method is like walking around with a tape measure measuring how high each swing set is, while the indirect method is like taking a few measurements of the tallest swings and estimating the rest. Each approach helps visualize the playground's layout differently according to what you need!
Key Concepts
-
Contour Lines: Lines on a map that represent points of equal elevation.
-
Contour Interval: The vertical distance separating each contour line, chosen based on scale and terrain.
-
Characteristics of Contour Lines: Distinct patterns that indicate features like hills, valleys, and overhangs.
-
Uses of Contour Maps: Critical for engineering applications, such as site selection and route planning.
-
Surveying Methods: Techniques used to derive elevation data, including direct and indirect methods.
Examples & Applications
An example of a contour line can be seen around a lake where the outer line represents the lake's edge at a specific elevation.
In flat terrain, contour lines will be spaced further apart compared to closely packed lines in hilly regions, indicating the slope steepness.
Memory Aids
Interactive tools to help you remember key concepts
Rhymes
Contour lines, they intertwine, showing heights that brightly shine.
Stories
Imagine a treasure map with contour lines indicating high and low grounds. You must navigate the valleys and hills to reach the treasure!
Memory Tools
NPSP for contour intervals: Nature, Purpose, Scale, People’s resources.
Acronyms
SCORE
Site selection
Cross-sections
Optimal routes
Reservoir capacity
Earthwork balance.
Flash Cards
Glossary
- Contour Line
An imaginary line on a map that connects points of equal elevation.
- Contour Interval
The constant vertical distance between successive contour lines.
- Direct Method
A surveying technique that measures the elevation of points directly along a contour line.
- Indirect Method
A surveying technique that uses known elevation points to interpolate and create contour lines.
- Digital Elevation Model (DEM)
A digital representation of the Earth's surface elevations, stored in a matrix format.
Reference links
Supplementary resources to enhance your learning experience.