
Hyperspectral Imaging Systems
Enroll to start learning
You’ve not yet enrolled in this course. Please enroll for free to listen to audio lessons, classroom podcasts and take practice test.
Interactive Audio Lesson
Listen to a student-teacher conversation explaining the topic in a relatable way.
Introduction to Hyperspectral Imaging
🔒 Unlock Audio Lesson
Sign up and enroll to listen to this audio lesson

Welcome, class! Today we’re diving into the fascinating world of hyperspectral imaging systems. Hyperspectral imaging collects data in numerous narrow spectral bands, allowing us to analyze various surface materials. Can anyone tell me how many bands are typically used in hyperspectral imaging?

Is it over a hundred bands?
Exactly! It often ranges from 100 to 200 bands. This technique provides a much richer dataset than multispectral imaging, which usually has about 3 to 10 bands. Can anyone name a common application for hyperspectral imaging?

Maybe in vegetation analysis?
Correct! Hyperspectral imaging is vital for identifying plant species and monitoring their health. Remember, the acronym VSS helps us remember Vegetation studies, Soil science, and Spectral analysis. Now, what other benefits does it bring?

It gives us more detailed data about materials based on their spectral signatures.
Great point! Let’s summarize: Hyperspectral imaging captures extensive spectral data, allowing for detailed material analysis—particularly beneficial in fields like agriculture and geology.
Key Technologies of Hyperspectral Imaging Systems
🔒 Unlock Audio Lesson
Sign up and enroll to listen to this audio lesson

Now that we've covered the applications, let's discuss the technologies that make hyperspectral imaging possible. Can someone tell me about the spectral filtering technique?
Is it the method that separates light into different bands?
Absolutely! This separation allows us to analyze very specific wavelengths of light. What about the detector array technology? How does it work?
It captures multiple spatial and spectral samples simultaneously using an array?
Exactly! This capability enhances the efficiency of data collection. Both technologies together enable the comprehensive analysis we perform with hyperspectral imagery. Let’s remember these key technologies as they are vital for effective data collection.
Applications of Hyperspectral Imaging
🔒 Unlock Audio Lesson
Sign up and enroll to listen to this audio lesson
Let’s switch gears to explore the applications of hyperspectral imaging. We've touched on vegetation—what specific aspect of vegetation can it help study?
It can help identify species and monitor health.
Right! Also, can anyone mention how it can aid in soil science?

For mapping soil types or assessing erosion.
Well said! Hyperspectral imaging allows for precise assessments in soil science. Lastly, let’s not forget geology. Why is hyperspectral imaging crucial for this field?
It helps in mineral identification.
Correct! Recall the mnemonic ‘Geology Uses Spectral’ to remember that geology benefits from spectral analysis. It plays a significant role in mineral exploration.
Challenges and Future Perspectives of Hyperspectral Imaging
🔒 Unlock Audio Lesson
Sign up and enroll to listen to this audio lesson
Now, let’s address the challenges hyperspectral imaging faces. Can someone highlight one major drawback?
I think managing large datasets can be difficult.
Yes! The analysis and interpretation of large datasets can quickly become complex. What about redundancy in bands—how might that affect our work?
It's challenging because we need to manage and reduce the redundant data.
Spot on! This issue can diminish the efficiency of analysis. However, as technology evolves, what can we expect in the future for hyperspectral imaging?
Maybe more advanced algorithms to process data more efficiently?
Exactly! Advancements in AI and machine learning could significantly enhance our ability to analyze hyperspectral data. Let’s recap: hyperspectral imaging faces challenges in data management but holds promise for the future.
Introduction & Overview
Read summaries of the section's main ideas at different levels of detail.
Quick Overview
Standard
Hyperspectral imaging captures detailed spectral information across numerous bands to analyze various scenes, including vegetation, soil, geology, and hydrology. This section covers the technology's components, applications, and challenges in remote sensing.
Detailed
Hyperspectral Imaging Systems
Hyperspectral imaging systems are advanced remote sensing technologies designed to collect detailed spectral information from various objects and phenomena on Earth. Unlike traditional multispectral imaging, which captures data in a limited number of bands (typically 3 to 10), hyperspectral imaging utilizes tens to hundreds of very narrow spectral bands (10-20 nm). This allows for comprehensive analysis of materials based on their spectral signatures.
Key Components of Hyperspectral Imaging Systems
- Spectral Filtering Technique: This technique separates the observed radiance into distinct narrow bands, enhancing the data's specificity.
- Detector Array Technology: This allows for multiple spatial and spectral samples to be collected simultaneously, improving data collection efficiency.
Notable Examples
- Hyperion Imaging Spectrometer: Launched by NASA as part of the EO-1 satellite, it provides images at 30 m resolution over 220 spectral bands, yielding rich data for improved surface characterization.
- Airborne Visible/Infrared Imaging Spectrometer (AVIRIS): Another NASA technology, capable of collecting data in 224 contiguous channels, also within the 0.4-2.5 μm wavelength range.
Applications
Hyperspectral images play a pivotal role across various scientific fields:
- Vegetation Studies: Including species identification, monitoring plant stress, and assessing canopy chemistry.
- Soil Science: Useful in soil type mapping and erosion status assessment.
- Geology: Essential for mineral identification and mapping.
- Hydrology: Helps in analyzing snow grain sizes and differentiating liquid from solid water.
- Water Quality Studies: Involves mapping phytoplankton and assessing sediment.
Despite its advantages, hyperspectral imaging poses challenges, including the complexity of managing vast amounts of data and reducing redundancy among the narrow bands. Nevertheless, it has significant real-world applications, particularly in mineral exploration, where specific
Youtube Videos


Audio Book
Dive deep into the subject with an immersive audiobook experience.
Multispectral vs. Hyperspectral Imaging
Chapter 1 of 6
🔒 Unlock Audio Chapter
Sign up and enroll to access the full audio experience
Chapter Content
Multispectral images are usually taken in 3 to 10 bands, where each band is obtained using a scanner/sensor/radiometer, whereas the hyperspectral images consist of much narrower bands (10-20 ηm) to record the images in more than hundred bands. In general, it comes from an imaging spectrometer.
Detailed Explanation
Multispectral imaging captures a limited number of wider spectral bands (3 to 10), which means it can gather data across broad wavelengths, but less detailed information per band. Hyperspectral imaging, in contrast, captures data in hundreds of much narrow bands (10-20 ηm), allowing for a more detailed analysis of materials since it can identify specific spectral signatures of different substances. Thus, hyperspectral imaging enables deeper insights into the scene being imaged.
Examples & Analogies
Imagine looking at a box of crayons where multispectral imaging is like picking a few crayons (3-10) to represent different colors, while hyperspectral imaging is akin to having a full set of crayons with hundreds of shades, allowing you to create more detailed and accurate drawings.
Key Component Technologies of Hyperspectral Sensors
Chapter 2 of 6
🔒 Unlock Audio Chapter
Sign up and enroll to access the full audio experience
Chapter Content
The hyperspectral sensors have two key component technologies. One is the spectral filtering technique by which the observed scene radiance is divided into narrow distinct bands. The other key is the detector array technology which allows multiple spatial and/or spectral samples through one- or two-dimensional arrays.
Detailed Explanation
Hyperspectral sensors rely on two main technologies: first, the spectral filtering technique allows these sensors to split the light they capture into very narrow channels, enabling specific wavelength analysis. Second, detector array technology provides the ability to collect numerous spatial or spectral samples simultaneously, enhancing the data acquisition process and ultimately leading to richer datasets that represent the characteristics of the target objects or areas.
Examples & Analogies
Consider a musician playing a symphony. The spectral filtering is like tuning an instrument to play only specific notes, while the detector array is akin to having multiple musicians playing together to create a rich and complex sound that captures the essence of the music.
NASA's Hyperion Imaging Spectrometer
Chapter 3 of 6
🔒 Unlock Audio Chapter
Sign up and enroll to access the full audio experience
Chapter Content
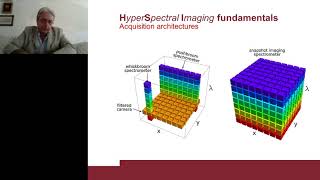
The NASA successfully launched the Hyperion imaging spectrometer (part of the EO-1 satellite) which gives 30 m resolution images in 220 spectral bands (0.4-2.5 μm) with a 30 m resolution. The data collected are often termed an 'image cube'...
Detailed Explanation
Hyperion is a notable example of a hyperspectral sensor, which captures images at a high resolution of 30 meters across 220 different spectral bands. This allows scientists to analyze very specific elements on Earth's surface and understand factors such as ecological conditions, land use, and surface materials. The 'image cube' structure means that data is organized in a three-dimensional format - two dimensions being spatial (height and width) and the third representing the spectral variation, allowing for detailed analysis of the spatial and material properties.
Examples & Analogies
Imagine a 3D puzzle where each piece represents a different spectral wavelength captured over a given land area. Just like you can see various colors in a 3D puzzle, the image cube allows scientists to visualize and analyze the complex interplay of materials on the Earth's surface.
Applications of Hyperspectral Imaging
Chapter 4 of 6
🔒 Unlock Audio Chapter
Sign up and enroll to access the full audio experience
Chapter Content
Hyperspectral images are being used in vegetation studies (species identification, plant stress, productivity, leaf water content, and canopy chemistry), soil science (type mapping and erosion status), geology (mineral identification and mapping) and hydrology (snow grain size, liquid/solid water differentiation).
Detailed Explanation
Hyperspectral imaging has diverse applications across various fields. It enhances our capabilities to identify plant species and assess their health by measuring water content and stress levels. In soil science, hyperspectral data can help in distinguishing different soil types and studying erosion patterns. Geologists can identify minerals, while hydrologists can distinguish between liquid and solid forms of water and analyze snow grain sizes, making this technology a vital tool for understanding and managing natural resources.
Examples & Analogies
Think of hyperspectral imaging as a powerful microscope that lets scientists clearly see differences in plant health or mineral types much like how a chef might examine the freshness of produce based on texture and color, helping in making informed decisions.
Processing Techniques for Hyperspectral Data
Chapter 5 of 6
🔒 Unlock Audio Chapter
Sign up and enroll to access the full audio experience
Chapter Content
Processing techniques generally identify the presence of materials through measurement of spectral absorption features. Often the hyperspectral data are post-processed to derive surface reflectance through the use of atmospheric radiative transfer models.
Detailed Explanation
To make sense of the complex data gathered by hyperspectral sensors, various processing techniques are employed. These typically involve analyzing specific wavelengths where materials absorb or reflect light differently (spectral absorption features). Post-processing steps are essential for translating raw data into usable surface reflectance values, which reveals the true characteristics of the observed materials by correcting for atmospheric interference.
Examples & Analogies
Imagine a photographer editing their photos to enhance clarity and true colors. Just like they use software to adjust brightness and contrast, scientists apply analytical techniques to hyperspectral data to obtain accurate reflections of the Earth's surface, making it easier to interpret the underlying environmental conditions.
Challenges of Hyperspectral Imaging
Chapter 6 of 6
🔒 Unlock Audio Chapter
Sign up and enroll to access the full audio experience
Chapter Content
One of the drawbacks with hyperspectral images is that it adds a level of complexity to reduce the redundancy from 200 narrow bands to work with. Hyperspectral images have many real-world applications, and give higher level of spectral detail and better capability to analyse minute information. For example, hyperspectral imagery has been used in mineral exploration.
Detailed Explanation
While hyperspectral imaging provides detailed data, its complexity can make data handling and analysis more challenging. Scientists often have to manage large datasets and extract relevant information from hundreds of narrow bands. This aspect demands advanced computational tools and algorithms for efficient data processing. However, the wealth of information obtained often outweighs these challenges, leading to significant advancements in fields such as mineral exploration, where detailed spectral data is critical for identifying resources.
Examples & Analogies
Consider preparing a large feast for a group of friends where you have to sort and manage many different ingredients (like each spectral band). It may take more time to organize everything, but the variety and richness of flavors resulted in a delightful meal, just as the complexity of hyperspectral data can lead to powerful insights once appropriately managed.
Key Concepts
-
Spectral Filtering: The method of separating light into various bands to facilitate detailed study.
-
Image Cube: A representation of hyperspectral data with spatial and spectral information.
-
Broad Applications: Uses in fields like geology, agriculture, and ecology for precise material analysis.
Examples & Applications
The Hyperion satellite captures data across 220 spectral bands to provide insights into land cover types.
Hyperspectral imaging analyzes plant health by assessing leaf reflectance at specific wavelengths.
Memory Aids
Interactive tools to help you remember key concepts
Rhymes
Hyperspectral captures wide and bright, analyzing Earth with spectral insight.
Stories
Once there was a scientist who could see the world through thousands of colors. Each color told a unique story about the plants, minerals, and waters—a magical tale of nature revealed through hyperspectral imaging.
Memory Tools
Use 'VSS' (Vegetation, Soil, Spectral) to remember types of analyses conducted with hyperspectral imagery.
Acronyms
HIMSS
Hyperspectral Imaging for Monitoring Subtle Signals.
Flash Cards
Glossary
- Hyperspectral Imaging
A technique that captures a wide spectrum of light across many narrow bands to allow detailed analysis of materials and phenomena.
- Spectral Filtering
The process of separating light into different narrow bands to examine specific wavelengths.
- Detector Array Technology
A technology that allows for simultaneous capture of multiple spatial and spectral samples.
- Image Cube
A data structure representing hyperspectral images with two spatial dimensions and one spectral dimension.
Reference links
Supplementary resources to enhance your learning experience.