
Marshall Mix Design
Enroll to start learning
You’ve not yet enrolled in this course. Please enroll for free to listen to audio lessons, classroom podcasts and take practice test.
Interactive Audio Lesson
Listen to a student-teacher conversation explaining the topic in a relatable way.
Overview of Marshall Mix Design
🔒 Unlock Audio Lesson
Sign up and enroll to listen to this audio lesson

Today, we're diving into Marshall Mix Design. Can anyone tell me what mix design generally aims to accomplish?

It determines how much bitumen should be used in asphalt mixtures.
Exactly! The goal is to find the optimal bitumen content for durability and performance. This process starts with specimen preparation. What do we need to do first?

We have to heat the aggregates and the bitumen, right?
Correct! We heat around 1200 grams of aggregates to 175-190°C before mixing in the heated bitumen at 121-125°C. Now, what do we do after mixing?

We compact it into a mold.
Right! We apply specific compaction techniques with a rammer. Remember this as 'HEAT-MOLD-COMPACT' for our steps! Can someone remind me of the key tests after specimen preparation?

The stability and flow tests!
Perfect! The stability test measures the maximum load, while the flow test measures deformation. By the end of this process, we define the optimum bitumen content for our mix.
Let's recap: HEAT-MOLD-COMPACT and then conduct STABILITY and FLOW tests. Great work today!
Properties of the Mix
🔒 Unlock Audio Lesson
Sign up and enroll to listen to this audio lesson

Now, what properties are especially important in Marshall Mix Design?
There’s theoretical specific gravity and bulk specific gravity.
Correct! The theoretical specific gravity, G_t, does not consider air voids, while bulk specific gravity, G_m, includes these voids. Can anyone explain why understanding these gravities is crucial?
It helps us determine the volume of bitumen and air voids in our mixes.
Absolutely! Also, we look at percent air voids, the volume of bitumen, and voids in mineral aggregate. What do you think happens if the air voids percentage is outside specified limits?
It could affect the durability and longevity of the pavement.
Exactly! High air voids can lead to moisture damage. Let’s remember this: 'VOID MATTERS!'. It’s crucial for our pavement performance.
Calculating Optimum Bitumen Content
🔒 Unlock Audio Lesson
Sign up and enroll to listen to this audio lesson
Now, how do we determine the optimum bitumen content after conducting our tests?
We look for the averages in our stability, G_m, and air voids.
Correct! You’ll take the average of three values corresponding to maximum stability, maximum G_m, and the desired air voids. What is this step commonly associated with?
Graphical analysis of our results!
Exactly! We plot these results, and the intersection points show us optimal ranges. Why is it critical to check against the Marshall specifications?
To ensure we meet the durability and performance standards.
Right! Strong mixes need to have good stability, controlled flow, and appropriate voids filled with bitumen. Great discussion team!
Applications and Implications of Marshall Mix Design
🔒 Unlock Audio Lesson
Sign up and enroll to listen to this audio lesson
To wrap up, what are the real-world implications of using Marshall Mix Design in pavement engineering?
It helps ensure the pavement can withstand traffic loads without cracking.
Correct. It directly impacts lifespan and maintenance costs. Can someone explain how this design method contributes to sustainability?
Efficient mix design can reduce material waste and extend durability.
Exactly! Using the right bitumen content helps reduce the overall environmental impact. A good takeaway is: 'DESIGN FOR DURABILITY AND SUSTAINABILITY'.
To summarize today's discussions, Marshall Mix Design is essential for effective pavement design, impacting durability, cost, and environmental sustainability.
Introduction & Overview
Read summaries of the section's main ideas at different levels of detail.
Quick Overview
Standard
In Marshall Mix Design, bitumen content is optimized through a series of stability and flow tests. Key properties such as specific gravity, air voids, and voids filled with bitumen are calculated to ensure the designed mix meets performance specifications for durability.
Detailed
Marshall Mix Design
Marshall Mix Design is a critical procedure in transportation engineering used to determine the optimum bitumen content within asphalt mixtures. The process begins with the preparation of aggregates and bitumen, followed by various tests that measure the performance of these mixtures under load. The Marshall stability and flow tests are central to this design framework, where the stability test evaluates the maximum load a specimen can endure, while the flow test measures the amount of deformation under this load.
Key Steps in Marshall Mix Design
- Specimen Preparation: Aggregates and filler are preheated, and bitumen is added and mixed thoroughly. Then, the mixture is compacted into molds to ensure a specific thickness.
- Property Determination: Important characteristics such as theoretical specific gravity, bulk specific gravity, air voids, and percent volume of bitumen are calculated.
- Stability and Flow Testing: The stability of a sample is tested by applying load until failure, while the degree of deformation is measured to determine flow values.
- Optimum Bitumen Content: Through graphical analysis and comparison of stability and flow results, the optimum binder content is selected based on performance criteria.
Key calculations involve the stability of the mix, flow values, and voids filled with bitumen, which ensure compliance with specifications for pavement performance.
Youtube Videos


Audio Book
Dive deep into the subject with an immersive audiobook experience.
Overview of Marshall Mix Design
Chapter 1 of 14
🔒 Unlock Audio Chapter
Sign up and enroll to access the full audio experience
Chapter Content
The mix design (wetmix) determines the optimum bitumen content. This is preceded by the dry mix design. There are many methods available for mix design which vary in the size of the test specimen, compaction, and other test specifications. The Marshall method of mix design is the most popular one and is discussed below. The Marshall stability and flow test provides the performance prediction measure for the Marshall mix design method.
Detailed Explanation
In this overview, we learn that Marshall Mix Design is a technique used to determine the best amount of bitumen to use in a concrete mixture, specifically for paving. Before applying this method, a dry mix design is needed. There are several methods for mix design, each differing in the specimen's size and how it compacts. The Marshall method stands out as the most widely used approach. The related 'stability and flow test' evaluates how well the mixture performs under stress by measuring the maximum load until failure and the flow of the specimen under pressure.
Examples & Analogies
Think of mixing ingredients for a cake. You have to find the right amount of flour, sugar, and butter to get the best texture and taste. Just like baking, mix design balances ingredients (in this case, bitumen and aggregates) to create a strong pavement that withstands heavy traffic.
Specimen Preparation
Chapter 2 of 14
🔒 Unlock Audio Chapter
Sign up and enroll to access the full audio experience
Chapter Content
Approximately 1200 gm of aggregates and filler is heated to a temperature of 175°C to 190°C. Bitumen is heated to a temperature of 121-125°C with the first trial percentage of bitumen (say 3.5 or 4% by weight of the material aggregates) to the heated aggregates and thoroughly mixed at a temperature of 154°C to 160°C. The mix is placed in a preheated mould and compacted by a rammer with 50 blows on either side at a temperature of 138°C to 149°C.
Detailed Explanation
In this chunk, we focus on how to prepare the specimen for the Marshall Mix Test. First, we need to heat a mixture of aggregates and filler until it reaches the right temperature, which is between 175°C and 190°C. Separately, we heat the bitumen to a slightly lower temperature. Then, we mix the heated bitumen into the aggregates thoroughly. Once combined, we place this mixture into a mold that is also preheated. Finally, we compress this mix using a rammer by applying 50 blows from both sides, ensuring the temperature stays between 138°C and 149°C for proper compaction.
Examples & Analogies
Imagine making dough for pizza. You warm up the flour and other ingredients to get them ready for mixing. After they’re heated, you mix them well and then apply pressure (like rolling it out) to make sure it holds together, just like compacting the mixture for the pavement.
Determining Properties of the Mix
Chapter 3 of 14
🔒 Unlock Audio Chapter
Sign up and enroll to access the full audio experience
Chapter Content
The properties that are of interest include the theoretical specific gravity G_t, the bulk specific gravity of the mix G_m, percent air voids V_v, percent volume of bitumen V_b, percent void in mixed aggregate VMA, and percent voids filled with bitumen VFB.
Detailed Explanation
This portion delves into the key properties we must determine during the Marshall Mix Design. We analyze several aspects: Theoretical specific gravity (G_t) considers only the solid materials, while bulk specific gravity (G_m) accounts for air voids. We also calculate the air voids percentage (V_v), the proportion of the mixture's volume that is bitumen (V_b), and the volume of voids in aggregates (VMA). Lastly, we measure what percentage of the voids is filled with bitumen (VFB). Each of these measures provides vital insights into how the mix will perform.
Examples & Analogies
Think of these properties like checking the ingredients in your pizza. You want to know how much cheese you have versus sauce, how airy your dough is, and how ‘packed’ all these ingredients are. This helps ensure that every slice has the right taste and texture.
Calculating Theoretical Specific Gravity G_t
Chapter 4 of 14
🔒 Unlock Audio Chapter
Sign up and enroll to access the full audio experience
Chapter Content
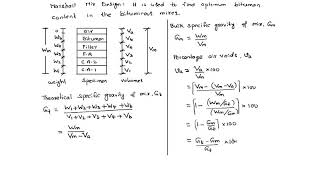
Theoretical specific gravity G_t is the specific gravity without considering air voids and is given by: G_t = (W_1G_1 + W_2G_2 + W_3G_3 + W_bG_b) / (W_1 + W_2 + W_3 + W_b)
Detailed Explanation
This chunk deals specifically with calculating the theoretical specific gravity of the mix, denoted as G_t. This calculation aims to determine how dense the mixture is without accounting for the air that may exist within the voids. It requires us to know the weights of the individual components (coarse aggregate, fine aggregate, filler, and bitumen) as well as their respective specific gravities. The formula combines these values to give us a single density measure.
Examples & Analogies
Consider the density of a sponge soaked in water. If you were to measure its weight without any air inside, it would be heavier, just like measuring the specific gravity without worrying about any air voids within the mixture.
Calculating Bulk Specific Gravity G_m
Chapter 5 of 14
🔒 Unlock Audio Chapter
Sign up and enroll to access the full audio experience
Chapter Content
The bulk specific gravity or the actual specific gravity of the mix G_m is the specific gravity considering air voids and is found out by: G_m = W_m / (W_m - W_w)
Detailed Explanation
In this segment, we focus on calculating the bulk specific gravity (G_m) of the mix, which incorporates the volume and weight of air voids. To obtain G_m, we measure the weight of the mix in the air (W_m) and the weight when submerged in water (W_w). This calculation is crucial for understanding how the mix will behave under operational conditions, where air voids are present.
Examples & Analogies
This is like weighing a bag of flour filled with air. When you weigh it in the air and then weigh it submerged in water, the difference helps you understand how much of its weight is actually 'real' versus just air trapped inside.
Calculating Air Voids Percent V_v
Chapter 6 of 14
🔒 Unlock Audio Chapter
Sign up and enroll to access the full audio experience
Chapter Content
Air voids V_v is the percent of air voids by volume in the specimen and is given by: V_v = (G_t - G_m) / G_t * 100
Detailed Explanation
Here, we learn how to calculate the percentage of air voids present in our mix, denoted as V_v. The formula subtracts the bulk specific gravity (G_m) from the theoretical specific gravity (G_t) and divides that difference by G_t before converting to a percentage. This calculation tells us how much of the mixture is filled with air, which can impact its strength and performance.
Examples & Analogies
Think of a sponge. If you squeeze all the air out, it’s more compact. This calculation helps us understand how 'squeezed' our mixture is. More air means less strength, just like a sponge with holes.
Volume of Bitumen V_b
Chapter 7 of 14
🔒 Unlock Audio Chapter
Sign up and enroll to access the full audio experience
Chapter Content
The volume of bitumen V_b is the percent of volume of bitumen to the total volume and given by: V_b = (W_b / (W_1 + W_2 + W_3 + W_b)) * G_b
Detailed Explanation
This section explains how to determine the volume of bitumen (V_b) as a percentage of the total mix. We use the weight of the bitumen (W_b) and the total weight of all components to calculate the ratio. Knowing V_b helps us understand how much bitumen contributes to the overall mix’s properties, such as flexibility and durability.
Examples & Analogies
It’s like knowing how much cheese is on your pizza compared to the total amount of toppings. More cheese can make the pizza richer, but too much can make it greasy, just like too much bitumen can affect the pavement’s strength.
Voids in Mineral Aggregate VMA
Chapter 8 of 14
🔒 Unlock Audio Chapter
Sign up and enroll to access the full audio experience
Chapter Content
Voids in mineral aggregate VMA is the volume of voids in the aggregates and is the sum of air voids and volume of bitumen, and is calculated from VMA = V_v + V_b
Detailed Explanation
We define Voids in Mineral Aggregate (VMA) as the total volume of voids created in the aggregate mix. It includes both the air voids we calculated earlier and the volume contributed by the bitumen. This measure is essential to ensure the mixture can adequately hold sufficient bitumen for performance purposes and overall stability.
Examples & Analogies
Imagine a glass filled with rocks and water. The spaces between rocks are like the voids in aggregates. By accounting for both the air and water, we can ensure there’s enough liquid in the glass to fill the gaps and provide strength.
Voids Filled with Bitumen VFB
Chapter 9 of 14
🔒 Unlock Audio Chapter
Sign up and enroll to access the full audio experience
Chapter Content
Voids filled with bitumen VFB is the voids in the mineral aggregate framework filled with the bitumen, and is calculated as: VFB = (V_b / VMA) * 100
Detailed Explanation
This portion defines the amount of voids in the mineral aggregate that are filled with bitumen, called VFB. It tells us how efficiently the bitumen fills in the gaps between the aggregates, which is crucial for ensuring the durability and stability of the pavement. We calculate this by dividing the volume of bitumen by the total voids in aggregate and converting it into a percentage.
Examples & Analogies
Think of how icing fills in the gaps between the layers of a cake. If there’s not enough icing, the cake might crumble. In a similar way, if our bitumen does not fill enough voids, the pavement can become weak.
Determining Marshall Stability and Flow
Chapter 10 of 14
🔒 Unlock Audio Chapter
Sign up and enroll to access the full audio experience
Chapter Content
Marshall stability of a test specimen is the maximum load required to produce failure when the specimen is preheated to a prescribed temperature placed in a special test head and the load is applied at a constant strain (5 cm per minute).
Detailed Explanation
In this section, we explore how to assess the Marshall stability and flow. Stability is defined as the maximum load that can be applied to the preheated specimen before it fails. During testing, the specimen is placed under controlled pressure, and the load is gradually increased until it can no longer withstand it. In parallel, we measure the deformation of the sample to evaluate its flow characteristics.
Examples & Analogies
Picture how much weight a stack of pancakes can hold before collapsing. If they become too heavy, they’ll squish and fall apart; likewise, we need to know how strong our pavement mix is before it fails.
Applying Stability Correction
Chapter 11 of 14
🔒 Unlock Audio Chapter
Sign up and enroll to access the full audio experience
Chapter Content
It is possible while making the specimen the thickness slightly vary from the standard specification of 63.5 mm. Therefore, measured stability values need to be corrected to those which would have been obtained if the specimens had been exactly 63.5 mm.
Detailed Explanation
In this section, we learn about the need to adjust our stability measurements based on the actual thickness of the specimens. As the thickness can vary slightly from the specified 63.5 mm, we use correction factors to ensure our results remain accurate and reliable, adjusting the stability values measured to reflect what they would be at the specified thickness.
Examples & Analogies
It’s like adjusting a recipe based on the type of baking pan you have. If your pan is deeper or shallower than the recipe suggests, you might need to adjust temperatures or cooking times to get the perfect bake, just like we adjust stability values for accurate testing.
Preparing Graphical Plots
Chapter 12 of 14
🔒 Unlock Audio Chapter
Sign up and enroll to access the full audio experience
Chapter Content
The average value of the above properties are determined for each mix with different bitumen content and the following graphical plots are prepared: 1. Binder content versus corrected Marshall stability, 2. Binder content versus Marshall flow, 3. Binder content versus percentage of void (V_v) in the total mix, 4. Binder content versus voids filled with bitumen (VFB), 5. Binder content versus unit weight or bulk specific gravity (G_m).
Detailed Explanation
This section emphasizes the importance of visualizing the results obtained from our tests. By plotting various characteristics against the binder content, we are able to observe trends and relationships, such as how the binder content influences stability, flow, air void percentages, and overall density. This graphical representation aids in making informed decisions regarding the optimal binder content.
Examples & Analogies
Think of a graph like a GPS navigation system. Instead of just getting written directions, you see a map with real-time updates on paths conformed by traffic. This helps you make informed decisions about the best route to take, just as plots help engineers visualize data for optimal mixes.
Determining Optimum Bitumen Content
Chapter 13 of 14
🔒 Unlock Audio Chapter
Sign up and enroll to access the full audio experience
Chapter Content
Determine the optimum binder content for the mix design by taking the average value of the following three bitumen contents found from the graphs obtained in the previous step: 1. Binder content corresponding to maximum stability, 2. Binder content corresponding to maximum bulk specific gravity (G_m), 3. Binder content corresponding to the median of designed limits of percent air voids (V_v) in the total mix (i.e. 4%).
Detailed Explanation
Here, we learn how to finalize the bitumen content that works best for the mix. We analyze three different criteria: the binder content that gives the highest stability, the one that maximizes the bulk specific gravity, and finally, one that keeps air voids within acceptable limits. The optimal bitumen content is then calculated as the average of these three values, ensuring a balance of performance and structural integrity.
Examples & Analogies
It’s like finding the perfect pizza recipe. You taste test three different recipes based on richness, texture, and how well they hold together. By averaging your favorite aspects of each, you get a final recipe that has the best overall flavor, just as we balance our test results for the ideal mix.
Summary of Marshall Mix Design Process
Chapter 14 of 14
🔒 Unlock Audio Chapter
Sign up and enroll to access the full audio experience
Chapter Content
The Marshal stability test is the performance prediction measure conducted on the bituminous mix. The procedure consists of the determination of properties of mix, Marshal stability and flow analysis, and finally, determination of optimum bitumen content.
Detailed Explanation
In this final summary chunk, we encapsulate the key phases of the Marshall Mix Design process. It includes assessing the mixture's properties, testing its stability and flow to predict how it will perform in real-world conditions, and concluding with identifying the optimum bitumen content necessary for optimal performance. This holistic approach emphasizes thorough testing and analysis.
Examples & Analogies
Consider this like preparing for a big event. You gather everything you need (testing mix properties), rehearse how it all goes (testing stability and flow), and finalize your plans based on what works best (finding optimal bitumen content) to ensure everything runs smoothly on the big day.
Key Concepts
-
Optimum Bitumen Content: The ideal percentage of bitumen needed for optimal mixture performance.
-
Marshall Stability: The measure of the maximum load that a specimen can withstand under specified conditions.
-
Air Voids: The percentage of air presence in an asphalt mixture, crucial for performance.
-
Flow Value: The measure of how much a specimen deforms under load, which needs to be controlled.
Examples & Applications
In a Marshall Mix Design test, a mixture containing 4% bitumen and having a stability value of 700 kg is deemed effective according to specifications.
A mixture with high flow values and low stability indicates it may crack under heavy loads, requiring adjustments in bitumen content.
Memory Aids
Interactive tools to help you remember key concepts
Rhymes
Heat it, mold it, compact it tight, Test stability, make it right!
Stories
Imagine engineers preparing a magic potion; they heat, stir, and compact their ingredients to create the perfect asphalt mixture!
Memory Tools
Remember 'He Molds Sturdy Bitumen' (HMSB) for the steps of preparing a Marshall mix.
Acronyms
SAV (Stability, Air voids, Volume of Bitumen) helps remember key properties to assess during mix design.
Flash Cards
Glossary
- Bitumen
A viscous liquid obtained from the distillation of crude oil, used as a binding agent in asphalt.
- Specific Gravity
A measure of the density of a material compared to the density of water.
- Air Voids
The space in an asphalt mixture not filled with asphalt, typically expressed as a percentage.
- Stability
The maximum load a test specimen can support under specified loading conditions.
- Flow Value
The amount of deformation a specimen undergoes under load, measured in 0.25 mm increments.
Reference links
Supplementary resources to enhance your learning experience.