
Calibration and Instrument Response
Enroll to start learning
You’ve not yet enrolled in this course. Please enroll for free to listen to audio lessons, classroom podcasts and take practice test.
Interactive Audio Lesson
Listen to a student-teacher conversation explaining the topic in a relatable way.
Understanding True Value vs. Measured Value
🔒 Unlock Audio Lesson
Sign up and enroll to listen to this audio lesson

Today, we're going to discuss the fundamental concepts of true value and measured value. Can anyone tell me what they think these terms mean?

I think true value is the actual amount of something we're trying to measure.
Exactly! The true value is the exact quantity we wish to measure. And what about the measured value?

Isn't the measured value what our instruments display when we take a measurement?
Correct! The measured value is what our instruments report. The goal is to minimize the difference between these two values. Let's remember that: **True = Actual; Measured = Instrument Output.**

But what causes errors between these two values?
Great question! Errors can arise from many factors, including instrument calibration, environmental conditions, and human error. Let's keep this in mind as we proceed.

So if measurements are consistent, does that mean we're accurate?
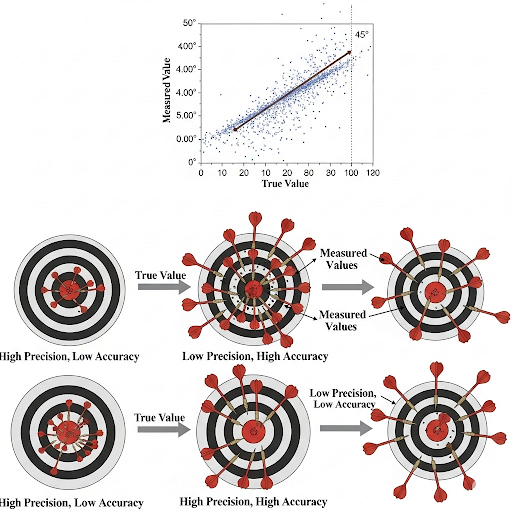
Not necessarily! Consistency refers to precision. Accuracy means your measurements are close to the true value. Let's recap: True value is what we aim for, measured value is what we see, and both accuracy (truth) and precision (consistency) are critical.
Understanding Standards in Measurement
🔒 Unlock Audio Lesson
Sign up and enroll to listen to this audio lesson

Let's discuss standards. Who can explain why we need standards in measurements?
Standards help confirm that our measurements are correct, right?
Exactly! Standards are known values used to verify measurements. Why do we trust standards?
Because they have been established by credible organizations!
Right! Organizations like ISO create and maintain these standards. Remember: **Standards = Trustworthy Benchmarks!** Now, how is a standard confirmed?
By using multiple balances to ensure they show the same value?
Perfect! The more consensus we reach across different measurements, the more valid the standard becomes.
So, if all balances confirm a value, do we then accept it as a standard?
Yes! This collective agreement is crucial for accurate measurements.
Calibration and Its Importance
🔒 Unlock Audio Lesson
Sign up and enroll to listen to this audio lesson
Now, let's dive into calibration. How does calibration help us measure accurately?
It adjusts our instruments to match the standards, right?
Absolutely! Calibration aligns our measurements with standards. Now, can you think of how often calibration should occur?
Maybe after a certain period or after we use the instrument several times?
Exactly! Calibration should be ongoing to check for any discrepancies over time. Think of it as **regular dentist check-ups to ensure your teeth are healthy!**
But how do we know a calibration is still valid after several measurements?
Great point! We can validate calibration by regularly measuring known standards and ensuring the results remain consistent. If there are significant changes, a recalibration is necessary.
So, we always need to double-check our instruments?
Absolutely! Consistent monitoring is essential to maintain measurement accuracy.
Calibration Plots and Instrument Response
🔒 Unlock Audio Lesson
Sign up and enroll to listen to this audio lesson
Finally, let's discuss calibration plots. Who can explain what a calibration plot represents?
It's a graph that shows the relationship between measured values and instrument response!
Precisely! And why are they important?
They help us determine the instrument's performance over a range of values!
Exactly! Calibration plots should ideally be linear. We can use the slope to calculate unknown values based on their responses. Remember: **Calibrated = Reliable!**
What if the plot isn't linear?
Good question! If the plot isn't linear, it indicates that we can't trust measurements outside the calibrated range.
So it’s crucial to have multiple calibration points?
Absolutely! Multiple points ensure greater reliability of the calibration plot.
Introduction & Overview
Read summaries of the section's main ideas at different levels of detail.
Quick Overview
Standard
The section details how calibration helps achieve accurate measurements by comparing measured values with recognized standards. It elucidates the concepts of true value, measured value, accuracy, precision, and how standards are established. Additionally, it highlights the significance of calibration plots and the instrument response in ensuring reliable measurements.
Detailed
Detailed Summary
Calibration is fundamental in ensuring that the instrument measurements reflect true values as closely as possible. In this section, we explore several key concepts: accuracy, precision, true value, measured value, and standards. The true value is the actual quantity being measured, and the measured value is what the instrument reports. Discrepancies between these values point to errors in measurement, emphasizing the need for calibration against established standards. Standards, defined by reputable organizations, serve as benchmarks for reliable measurement, akin to renowned entities like ISO, ensuring global consistency in measurements.
The reliability of an instrument’s output is reinforced through the creation of calibration plots, which illustrate the relationship between measured values and instrument response. The discussion extends to the necessity of continuously checking the calibration to account for any shifts over time, ensuring measurement integrity. Overall, achieving high accuracy relies heavily on regular calibration and adherence to standards, with the effects of discrepancies between measured and true values driven home through visual aids and emphasis on instrument response dynamics.
Youtube Videos


Audio Book
Dive deep into the subject with an immersive audiobook experience.
Understanding True Value and Measured Value
Chapter 1 of 5
🔒 Unlock Audio Chapter
Sign up and enroll to access the full audio experience
Chapter Content
So, the question about accuracy that we discussed last class was true value versus measured value. This true value means whatever you are measuring its actual value that supposed to be and you are measuring something else. Usually, the idea is to bring the measured value as close as possible to the true value, that’s the goal. This true value and measured value are not equal, which implies that there are errors associated with the measurement itself and the errors can arise from different sources for various reasons.
Detailed Explanation
In this chunk, we learn about the concepts of 'true value' and 'measured value' in the context of accuracy in measurements. The 'true value' refers to the actual value of the quantity being measured, while the 'measured value' is what instruments provide us after taking a measurement. The objective in any measurement task is to make the measured value as close to the true value as possible. However, discrepancies between these two values signify that there are errors involved, and it is crucial to understand that these errors may come from various sources.
Examples & Analogies
Imagine trying to hit the bullseye in an archery competition. The bullseye represents the true value, and each arrow you shoot represents the measured value. Some arrows may hit close to the bullseye, indicating accurate measurements, while others might miss, showing the errors in your aim. Over time, with practice, you would want to consistently hit closer to the bullseye.
Defining Standards
Chapter 2 of 5
🔒 Unlock Audio Chapter
Sign up and enroll to access the full audio experience
Chapter Content
In order to do this, we compare the measured value to what is called a standard. A standard is something that is known to be of a certain value. Who decides standards? Standards are a very strict business. Usually, it is a global association. You have heard of international standards organizations (ISO). Standards are crucial for accurate measurements as they provide a reference point.
Detailed Explanation
This chunk focuses on the importance of standards in measurements. A standard provides a reference value that is widely accepted and used for comparisons. It is necessary for determining the accuracy of a measurement because it offers a benchmark. Organizations like the International Standards Organization (ISO) help in establishing and maintaining these standards globally, ensuring that everyone uses consistent values.
Examples & Analogies
Think of standards as the rules of a game. For instance, in soccer, the dimensions of the goalpost are standardized so that every match played anywhere in the world maintains the same conditions. Just as players need to know the rules and dimensions to play fairly, scientists need established standards to ensure accurate and consistent measurements.
Calibration and Instrument Response
Chapter 3 of 5
🔒 Unlock Audio Chapter
Sign up and enroll to access the full audio experience
Chapter Content
In this calibration, if you get a calibration like this, you have a response versus this measured variable. This is the response what the instrument is reporting. Usually, instruments have an internal response, say in terms of millivolts or other signal intensities. The response of an instrument must be linked with actual measurements to ensure reliability.
Detailed Explanation
Calibration refers to the process of adjusting an instrument so that its output (response) accurately measures the standard or known values. The relationship between the response reported by the instrument and the actual quantities (like mass or concentration) is crucial for reliability. If an instrument is not calibrated correctly, it may lead to significant errors in measurements, affecting the validity of test results.
Examples & Analogies
Imagine you have a scale at home that weighs items, but it hasn't been calibrated. If someone asks you to weigh 1 kg of flour, but your scale shows only 0.8 kg, your baking recipe will be off. Just as you rely on a correctly calibrated scale to measure weight accurately, scientists rely on calibrated equipment to ensure the precision of their measurements.
Using Calibration Curves
Chapter 4 of 5
🔒 Unlock Audio Chapter
Sign up and enroll to access the full audio experience
Chapter Content
If I have this calibration curve, if I have an unknown sample, I take an unknown sample put it on a balance, I will get some response. Let us say this response is green in color. I can calculate what is the mass by using this calibration plot and going this is the mass of my unknown sample.
Detailed Explanation
This chunk explains how calibration curves are used in practice. A calibration curve is a graphical representation that shows the relationship between known values (standards) and the instrument's response. By using this curve, we can determine the unknown quantity by referencing where its response falls on the curve. This method emphasizes the importance of earlier calibration work so that unknown samples can be analyzed accurately based on the established relationship.
Examples & Analogies
Think of a color chart that helps you mix the right shades of paint. If you want a specific color for your project, you refer to the chart which shows how to combine different colors. Similarly, a calibration curve acts as a guide in the lab, helping scientists determine unknown quantities by referring back to established values, ensuring their work is accurate.
Maintaining Calibration Over Time
Chapter 5 of 5
🔒 Unlock Audio Chapter
Sign up and enroll to access the full audio experience
Chapter Content
How can I check if the calibration still holds good after some time? In other words, how can we check the calibration is valid? The only way to check is by measuring the standard regularly. If the response is going up or down, it may go up or down a little bit. Calibration is not a permanent thing.
Detailed Explanation
In this chunk, we learn that calibration is not a one-time task; it requires regular checks to ensure ongoing accuracy. Over time, instruments may drift due to wear or environmental conditions, which can affect their reliability. By periodically measuring known standards, laboratory personnel can confirm whether the instruments still provide accurate results or if recalibration is necessary.
Examples & Analogies
Picture a car's alignment, which can get out of balance over time due to driving on bumpy roads. To ensure smooth driving, car owners regularly take their vehicles for alignment checks. Similarly, scientists must consistently check the calibration of their instruments to ensure they provide accurate and reliable measurements over time.
Key Concepts
-
True Value: The actual quantity being measured that we aim to achieve.
-
Measured Value: The reading given by the measuring instrument.
-
Calibration: The adjusting of an instrument to ensure it outputs values that align with standards.
-
Standards: Established reference points for measurement accuracy.
Examples & Applications
A laboratory uses a standardized weight to calibrate a balance scale, ensuring it's accurate when measuring sample masses.
A pH meter is calibrated using buffer solutions of known pH to ensure its readings are accurate.
Memory Aids
Interactive tools to help you remember key concepts
Rhymes
To measure right, use standards bright, tweak your scales to see the light!
Stories
Once upon a time, in a lab so bright, instruments danced, but calibration was their guiding light, leading them to accurate readings day and night.
Memory Tools
Remember 'SAT' - Standards Are Trustworthy in making measurements accurate.
Acronyms
CAL - Calibration Aligns Measurements with standards.
Flash Cards
Glossary
- True Value
The actual measurement or quantity that is being assessed.
- Measured Value
The value displayed by an instrument when a measurement is taken.
- Accuracy
The degree to which a measured value aligns with the true value.
- Precision
The consistency of repeated measurements, regardless of accuracy.
- Calibration
The process of adjusting an instrument to ensure its output aligns with recognized standards.
- Standard
A known value established by reputable organizations used for comparison in measurements.
- Calibration Plot
A graphical representation of the relationship between measured values and instrument responses.
Reference links
Supplementary resources to enhance your learning experience.