
Signal to Noise Ratio
Enroll to start learning
You’ve not yet enrolled in this course. Please enroll for free to listen to audio lessons, classroom podcasts and take practice test.
Interactive Audio Lesson
Listen to a student-teacher conversation explaining the topic in a relatable way.
Introduction to Signal
🔒 Unlock Audio Lesson
Sign up and enroll to listen to this audio lesson

Welcome class! Let's talk about the concept of the signal first. A signal in our case refers to the data we obtain from our measurements, such as the concentration of a pollutant. Who can tell me why this is important?

It's important because we need to know how much of a pollutant is present in the environment!
Exactly! The accuracy of that concentration is crucial for environmental monitoring. Now, what about noise? Does anyone know what we mean by noise in this context?

Is it the random fluctuations that can affect our readings?
Yes, noise represents unwanted variations that can obscure our signal. Think of it as background chatter that makes it hard to hear a conversation. So, when measuring, our goal is to have a strong signal above this noise.

What's a good way to make sure the signal we measure is accurate?
Good question! A key strategy is to ensure a high signal to noise ratio or SNR. A higher SNR assures that our measurements are reliable. Remember, if our signal is close to the noise level, we can't trust our readings fully.
To summarize: The signal is what we measure, noise is any interference, and a good SNR means our data is trustworthy.
Detection Limits
🔒 Unlock Audio Lesson
Sign up and enroll to listen to this audio lesson

Now, let’s move on to detection limits. Can anyone explain what a detection limit is?

It’s the smallest amount of a substance that can be reliably detected?
Exactly! There are two types we need to focus on: the instrument detection limit and the method detection limit. Can anyone tell me the difference?
The instrument detection limit applies to the specific equipment, while the method detection limit considers how we use that equipment?
Right! The MDL is crucial as it illustrates how the method used to measure can affect our readings. And why is knowing our detection limits important?
It helps us understand how much of a sample we need to analyze to ensure we get reliable results!
Correct! To ensure we measure an amount that exceeds the detection limit, we might need a certain volume of the sample to guarantee our signal is above the noise. Excellent insights, everyone!
Signal to Noise Ratio Importance
🔒 Unlock Audio Lesson
Sign up and enroll to listen to this audio lesson
Let’s now talk about the importance of the signal to noise ratio. How does a high SNR affect our measurements?
A higher SNR means our readings are more accurate and less influenced by noise?
Exactly, well done! In analytical chemistry, a high SNR is essential because it allows us to detect small changes in concentration reliably.
What happens if we have a low SNR?
Good question! A low SNR means the signal is too close to the noise, implying less reliability in our measurements. We cannot trust the readings, and it could lead to false conclusions.
Is there a way to improve the SNR?
Yes! We can improve SNR by using better instruments, increasing sample volume, or employing advanced analytical techniques. Remember, our goal is always to ensure that the signal stands out from the noise.
To sum up, a high SNR leads to reliable measurements and accurate data interpretation is critical for environmental assessments.
Statistical Methods in SNR
🔒 Unlock Audio Lesson
Sign up and enroll to listen to this audio lesson
Finally, let’s discuss the statistical aspect of SNR. How can we statistically validate if our signal is different from noise?
Are there statistical tests we can use?
Correct! We typically use methods like hypothesis testing to determine if our measured signal is significantly distinct from the noise. Can anyone think of a threshold that is often used in practice?
Is it about 10% difference to confirm a signal?
Yes! A 10% difference is commonly accepted to confirm that a signal is reliably detected and not just noise. It ensures some level of confidence in our findings.
Why is that level of confidence important?
Because accurate interpretation of data is crucial, especially in environmental contexts where decisions can affect public health and safety. Remember, understanding statistics allows us to back our findings strongly.
In summary, we use statistical methods to confirm whether our readings are above the noise, typically requiring at least a 10% difference for confidence.
Introduction & Overview
Read summaries of the section's main ideas at different levels of detail.
Quick Overview
Standard
The section elaborates on the signal to noise ratio, illustrating its significance in ensuring the reliability of measurements in environmental quality assessments. It discusses how noise can affect readings and introduces concepts such as detection limits and method detection limits, highlighting their roles in determining how much of a sample should be analyzed.
Detailed
Signal to Noise Ratio
The signal to noise ratio (SNR) is a critical concept in analytical chemistry, especially in environmental monitoring. In essence, the SNR quantifies how much a signal (the measurable effect) stands out from the background noise (unwanted variations). A higher SNR indicates a more reliable measurement.
Key Points:
- Definition of Signal and Noise:
- The signal refers to the data obtained from measurements, such as concentrations detected by instruments. Noise refers to any interfering factor that contributes background fluctuations in readings, making it difficult to discern true values.
- Measurement Challenges:
- High levels of noise can obscure the true signal, making it difficult to determine exact concentration levels. This creates uncertainty, especially when the signal is close to the noise level.
- Detection Limits:
- This refers to the smallest concentration of an analyte that can be reliably detected by the analytical method.
-
There are two types of detection limits:
- Instrument Detection Limit: The minimum concentration detectable by the instrument under ideal conditions.
- Method Detection Limit (MDL): This takes the method used to acquire the sample into account, determining how reliable the detection is considering the instrument's precision and noise levels.
- Improvements via Sample Volume:
- To exceed the detection limits, an adequate sample volume must be collected such that even low concentrations provide measurable differences above background noise.
- Statistical Methods:
- SNR can be mathematically evaluated using statistical methods, and it is generally accepted that a minimum differentiation of about 10% is necessary to confirm a true signal.
Understanding SNR is vital for ensuring precise environmental quality assessments through effective monitoring and analytical strategies.
Youtube Videos


Audio Book
Dive deep into the subject with an immersive audiobook experience.
Understanding Signal and Noise
Chapter 1 of 4
🔒 Unlock Audio Chapter
Sign up and enroll to access the full audio experience
Chapter Content
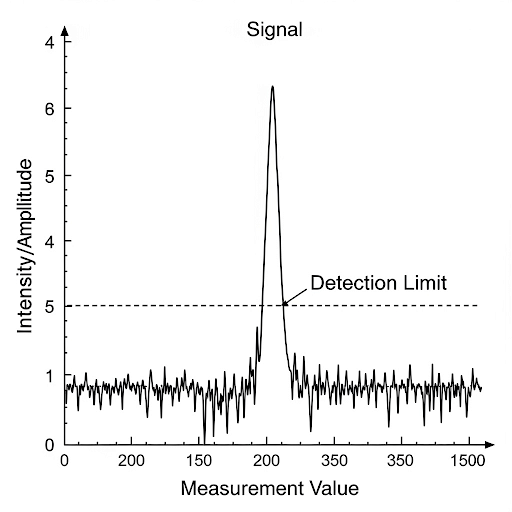
This signal in the green is much significantly greater than the noise. This signal in the blue I am not sure, but almost the same as the noise.
Detailed Explanation
In measurement systems, we often encounter two types of data: signal and noise. The signal represents the actual information we want to capture, while noise refers to random fluctuations or interruptions that can obscure the true signal. In the example above, the green signal is distinctly above the level of noise, indicating that we can trust this data point. Conversely, when a signal is similar in strength to the noise (as indicated by the blue signal), it becomes challenging to distinguish between real information and random fluctuations. This uncertainty can lead to incorrect interpretations of data.
Examples & Analogies
Imagine listening to music on a radio while you're in a busy café. The music is the signal, and the chatter and clanking of dishes are the noise. When the music is loud enough compared to the noise, you can enjoy it clearly. However, if the chatter becomes too loud and overlaps with the music, it’s hard to tell what the song is. Similarly, in scientific measurements, we want our 'music' (signal) to be clear compared to the 'chatter' (noise).
Signal to Noise Ratio (SNR)
Chapter 2 of 4
🔒 Unlock Audio Chapter
Sign up and enroll to access the full audio experience
Chapter Content
Signal to noise ratio, the general assumption this gives you rise to a term which is called as method detection limit.
Detailed Explanation
The signal-to-noise ratio (SNR) is a critical parameter in evaluating the quality of a measurement. It describes how much of the signal is present compared to the noise. A higher SNR indicates a clearer distinction between the signal and noise, which leads to more reliable and accurate results. Consequently, the concept of 'method detection limit' arises from SNR, representing the lowest quantity of an analyte that can be reliably measured above the background noise. To ensure valid measurements, practitioners must achieve a satisfactory SNR during experiments.
Examples & Analogies
Think of a photographer trying to take a clear picture in a dimly lit room. If the camera's flash is strong (high signal) compared to the ambient lighting (noise), the photo will be clear and vibrant. However, if the room is too dark, and the flash is not powerful enough, the picture will come out blurry or grainy. In analytical chemistry, ensuring a good SNR is akin to using a strong flash to capture clear images of a sample's true composition.
Detecting the Signal Amidst Noise
Chapter 3 of 4
🔒 Unlock Audio Chapter
Sign up and enroll to access the full audio experience
Chapter Content
Statistical hypothesis testing will verify if this distribution, signal numbers that you are getting is different significantly from the noise.
Detailed Explanation
Statistical hypothesis testing is a method used to determine whether the obtained signal is significantly different from the noise. By analyzing numerous measurements, scientists can calculate the average and variability of both the signal and the noise. If the signal is consistently greater than the noise by a defined margin, we can conclude with confidence that the signal exists and is not just a product of noise. This process relies on statistical tools that provide a framework for making scientifically valid decisions based on the collected data.
Examples & Analogies
Imagine a scientist measuring the concentration of pollutants in air samples - if a specific pollutant is consistently detected at levels that are significantly higher than the fluctuations of the background air quality (noise), the scientist can confidently assert that the pollutant is present. This scenario is akin to using a microphone to capture a speaker's voice over a noisy crowd; if the speaker's voice can be consistently heard over the noise, it signifies clear communication.
Method Detection Limit (MDL)
Chapter 4 of 4
🔒 Unlock Audio Chapter
Sign up and enroll to access the full audio experience
Chapter Content
Here we take the term method detection limit as it is defined as 3 multiplied by sigma, which is the standard deviation of what is called as a blank.
Detailed Explanation
The method detection limit (MDL) is defined as a statistical measure of the lowest concentration level that can be reliably detected. Mathematically, it is often calculated as 3 times the standard deviation (sigma) of background noise or blank measurements. This formula signifies that a measurement must be 3 times the fluctuation of noise to be considered reliable and not just a chance occurrence. It ensures that any detected signal indicates a true presence above the baseline noise level, thereby improving measurement validity.
Examples & Analogies
Consider a teacher who grades students on their test scores. To identify whether a student truly performed well, the teacher knows that scores should exceed a certain threshold based on variations from average performance. If a student scores above three times the usual variation from the average score, it clearly indicates their strong performance. Similarly, the MDL function helps scientists discern whether the detected signal in an experiment is truly meaningful.
Key Concepts
-
Signal vs. Noise: Understanding the fundamental relationship between measurable data (signal) and interference (noise).
-
Detection Limits: Importance of determining the minimum concentration of analytes that can be influenced by instrument capabilities and method variance.
-
Method Detection Limit (MDL): Recognizing how methods quality affects detection ability.
-
Signal to Noise Ratio: High SNR ensures reliability and accuracy in measurements, particularly in environmental assessments.
Examples & Applications
When measuring particulate matter in air, the SNR helps ensure that the concentration readings we observe reflect the actual pollution levels despite background noise.
In laboratory analyses, a low SNR might result in false negatives, where actual contaminants go undetected if they’re below the detection limit.
Memory Aids
Interactive tools to help you remember key concepts
Rhymes
When signals beat the noise so strong, reliable measurements can't go wrong.
Stories
Imagine two friends talking. One whispers a secret (the signal), while the other is busy playing loud music (the noise). To hear the secret clearly, the whisper needs to be much louder than the music - this is similar to how we need a good SNR!
Memory Tools
SNR: 'Signal Needs Reassurance' - to always be distinct from Noise.
Acronyms
SNR - Stronger Noise Reduction for clear measurements.
Flash Cards
Glossary
- Signal
The measurable effect or data obtained from an analytical measurement, such as pollutant concentration.
- Noise
Random fluctuations and interfering factors that can obscure the true signal or measurement.
- Signal to Noise Ratio (SNR)
A measure that compares the level of a desired signal to the level of background noise; a higher SNR indicates a more reliable measurement.
- Detection Limit
The smallest concentration of an analyte that can be reliably detected by an analytical method.
- Instrument Detection Limit
The minimum concentration detectable by the instrument under ideal conditions.
- Method Detection Limit (MDL)
The lowest concentration that can be accurately measured using an analytical method, accounting for the method's performance.
Reference links
Supplementary resources to enhance your learning experience.