
Measurement Protocols and Standards
Enroll to start learning
You’ve not yet enrolled in this course. Please enroll for free to listen to audio lessons, classroom podcasts and take practice test.
Interactive Audio Lesson
Listen to a student-teacher conversation explaining the topic in a relatable way.
Introduction to Measurement Protocols
🔒 Unlock Audio Lesson
Sign up and enroll to listen to this audio lesson

Today, we'll begin by understanding what measurement protocols are and their significance in monitoring particulate matter. Can anyone explain what they think is meant by measurement protocols?

I think they are the methods we use to measure pollution levels?
Exactly! Measurement protocols define how we assess air quality. They're tailored based on location and equipment available. What might be some factors that affect these protocols?

Maybe the amount of pollution or the kind of instruments we have?
Great point! Instruments vary in capability, which can lead to adjustments in standards. One acronym to remember these factors is PACE: Pollution levels, Available technology, Context of environment, and Equipment used. So, what would you prioritize when selecting a sampler?

I guess the environment and the type of particles we want to measure?
Absolutely! Different environments could mean different protocols. To recap, measurement protocols are adaptable but must align with our objectives.
High Volume Samplers
🔒 Unlock Audio Lesson
Sign up and enroll to listen to this audio lesson

Next, let's dive into high-volume samplers. Has anyone heard of these before?

I have! They collect more air, right?
Exactly! They usually sample air over an 8-hour period in urban settings. Why do you think longer sampling times might be necessary in pristine areas?
Because there are fewer pollutants, so we need more time to get enough data?
Spot on! Longer sampling durations help collect sufficient data for accurate values. Remember, PM concentrations are reported in micrograms per cubic meter. Can you explain why that unit is chosen over larger units?
Because particulate matter is usually found in very small amounts?
Correct! To summarize, high-volume samplers help measure significant air volumes efficiently but require careful consideration of sampling durations.
Understanding Particulate Matter Classifications
🔒 Unlock Audio Lesson
Sign up and enroll to listen to this audio lesson
Let's explore the classifications of particulate matter, especially PM10 and PM2.5. Who can describe the difference between them?
Uh, PM10 is bigger than PM2.5, right? Like more than 2.5 micrometers?
Exactly! PM10 includes PM2.5 particles. Why do you think it's vital to collect data on these sizes?
Because different sizes can affect health differently?
Absolutely! Smaller particles can penetrate deeper into the lungs. Hence, it's essential to monitor them closely. An easy way to remember this is the phrase: 'Ten is greater; two and a half must be in the greater.'
I like that! It makes it easier to remember which one is which.
Great! In summary, understanding the sizes of particulate matter allows for better public health outcomes.
Real-Time Monitoring Techniques
🔒 Unlock Audio Lesson
Sign up and enroll to listen to this audio lesson
Now let's look at real-time monitoring techniques. Why is it essential for regulatory agencies to access real-time data?
So they can respond quickly to pollution spikes?
Exactly! Real-time monitoring allows timely responses. For instance, how would you rate the importance of rapid feedback when managing air quality?
Very important! It helps in effective decision-making, especially in emergencies.
Yes! Technologies like Beta Gauge monitors and laser-based systems are evolving. One piece of advice is to remember the term ABC: Accuracy, Brevity, and Consistency in monitoring!
That's a helpful acronym! It breaks down the important aspects well.
To conclude, real-time monitoring transforms how we manage air quality effectively.
Introduction & Overview
Read summaries of the section's main ideas at different levels of detail.
Quick Overview
Standard
This section details how measurement protocols depend on the location and available technology, like high-volume samplers and impactors. The impact of sampling durations on data accuracy and standards evolution with technological advancements are emphasized.
Detailed
Measurement Protocols and Standards
In this section, we explore how measurement protocols for particulate matter (PM) sampling are crucially influenced by the context of their application, including the environment being sampled and the technology employed. The discussion begins with high-volume samplers, which require careful consideration of sampling periods—minimums of 8 hours in urban areas versus potentially 24 hours in pristine locations.
It emphasizes that every method carries limitations, such as a loss of data fidelity when cheaper technologies are adopted. Standards for measurements evolve as the available technology advances and are directly related to the accuracy of the instruments.
Specific examples of measuring equipment, like cyclone samplers and PM10/PM2.5 impactors, illustrate the detailed designs needed to accurately capture the particulate matter based on specific sizes and flow rates. Furthermore, the section discusses the significant role of average calculations over longer timescales, which aid in gauging pollution sources and trends. This indicates the intertwining of regulatory practices with real-time monitoring technologies, which are essential for effective environmental management.
Youtube Videos


Audio Book
Dive deep into the subject with an immersive audiobook experience.
Impact of Measurement Method Cost
Chapter 1 of 8
🔒 Unlock Audio Chapter
Sign up and enroll to access the full audio experience
Chapter Content
So you have to have cheaper methods of doing it. But when you have cheaper method of doing it, you are obviously going to have the loss of information. So, PM sampler is high volume sampler, you can use measurement you can measure it using a 4 digit balance, but then you are losing information because your sampling period is now 8 hours minimum sampling period of 8 hours in a urban area where you have a reasonable amount of dust.
Detailed Explanation
This chunk discusses the trade-off between cost and information when measuring particulate matter (PM) concentration. Cheaper methods, such as using a PM sampler, can reduce the amount of information available. For instance, when you use a high-volume PM sampler, it typically has a longer minimum sampling period (usually 8 hours), which can lead to missing finer details of air quality changes over shorter periods. Consequently, while the method is more economical, it may sacrifice the precision and detail of the readings.
Examples & Analogies
Think of it like using a very inexpensive camera to take pictures of an event. While you can capture a broad overview over a longer period, you might miss important details that a professional camera could capture in a shorter time, such as the expressions of participants in the moment.
Measurement Duration and Conditions
Chapter 2 of 8
🔒 Unlock Audio Chapter
Sign up and enroll to access the full audio experience
Chapter Content
If you go to a very pristine area, you may not get anything in it, you may have to run it for 24 hours to get something. So, you see that the measurement protocols are all dependent on what is available for measurement and where you are measuring and so therefore, the standards are defined based on that.
Detailed Explanation
This chunk emphasizes that measurement protocols vary based on the sampling location and environmental conditions. In areas with low pollution, such as pristine environments, longer sampling times (up to 24 hours) may be necessary to detect any particulate matter, as the concentration is very low. This variability requires standards to be adaptable to different contexts.
Examples & Analogies
Imagine trying to catch rainwater in a bucket. In a light drizzle, you might need to leave the bucket out for an extended time to collect enough water, whereas in a heavy rain, the bucket fills up quickly. This conveys how conditions affect the sampling duration required to gather sufficient data.
Instrument Innovation and Standards
Chapter 3 of 8
🔒 Unlock Audio Chapter
Sign up and enroll to access the full audio experience
Chapter Content
Somebody says I have an instrument which will measure PM10 for 1000 rupees. Everybody will shift to that now, because you can get a wide network of this instrumentation and that is it. And if you can prove that it is correct accurate, then that will be the new standard now.
Detailed Explanation
Innovation in measurement instruments can drive changes in standards. If a new device can accurately measure PM10 for a low cost (e.g., 1000 rupees), it can lead to widespread adoption across various sectors. If validated, this device can establish new standards for measurement, showing how advancements in technology can influence accepted practices in air quality monitoring.
Examples & Analogies
Consider how smartphones have replaced traditional cameras for the average user. When a smartphone camera improved in quality and became more affordable, many people shifted to using them for photography, which changed the standard of 'good enough' photography for daily use.
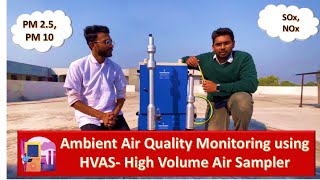
High Volume Sampler Design
Chapter 4 of 8
🔒 Unlock Audio Chapter
Sign up and enroll to access the full audio experience
Chapter Content
Now this is a very specific company. That is why it is called an RSPM. People design this based on the impactor, here it is a cyclone in this particular instrument. It doesn’t have to be a cyclone, can be anything and it uses a large filter paper which is a sheet that uses a glass microfiber filter of 8 by 10 inches which is like an A4 size sheet.
Detailed Explanation
This segment provides insight into a specific high-volume sampler known as RSPM, which utilizes a cyclone design as part of its measurement mechanism. The sampler uses a large filter paper to collect particulate matter. The size and material of the filter are critical for effective sampling, impacting its efficiency and accuracy.
Examples & Analogies
You can think of the sampler as a giant vacuum cleaner that uses a specific type of filter to capture dust and debris. The larger the filter and the better the design, the more effectively it can collect dust particles, similar to how a well-designed filter in a vacuum can trap more dirt from the floor.
Calculating Concentrations from Samples
Chapter 5 of 8
🔒 Unlock Audio Chapter
Sign up and enroll to access the full audio experience
Chapter Content
And you can sample 8 hours and 1000 liters per minute, large volume you can imagine how much of air is going through that so the amount of particulate it collects is significant. So at the end of it you weigh the filter paper before and after and you get total mass divided by total volume.
Detailed Explanation
In this portion, the process of collecting air samples is explained. The high volume sampler can process 1000 liters of air per minute for 8 hours. After sampling, the filter paper is weighed before and after the collection. The concentration of particulate matter is calculated by dividing the mass collected by the total volume of air sampled, usually reported in micrograms per cubic meter.
Examples & Analogies
Imagine baking cookies: you measure the amount of dough before putting it in the oven and then weigh the leftover dough afterwards. To find out how much cookie 'mass' you lost while baking, you could calculate it based on how much you started with, just like measuring how much particulate matter is lost in the air.
Types of Samplers: PM2.5 and PM10
Chapter 6 of 8
🔒 Unlock Audio Chapter
Sign up and enroll to access the full audio experience
Chapter Content
So, PM 2.5 is all 24-hour sampling intervals measurement, so, you cannot do anything. So, I cannot get any information on a lower timescale, it is all 1-day average, 24-hour average only. But this is okay because it again depends on the objectives.
Detailed Explanation
This section describes the sampling intervals for PM2.5 and PM10. While PM10 sampling can be more flexible, PM2.5 often relies on 24-hour averaging, meaning data is aggregated over an entire day rather than in shorter intervals. This practice is acceptable depending on the research objectives, often aimed at understanding long-term air quality trends rather than instantaneous measurements.
Examples & Analogies
Think of this like recording temperatures throughout the day: if you only check once daily, you get an average temperature, which is fine for understanding daily trends, but you miss peaks or troughs that might occur during the day.
Cascade Impactors for Particle Size Distribution
Chapter 7 of 8
🔒 Unlock Audio Chapter
Sign up and enroll to access the full audio experience
Chapter Content
So, this is what is called as cascade impactor, cascade impactor is just an impactor but you have multiple impactors that one place after the other. You can see this schematic diagram here that it is going in the first one, there is the first impact that goes through this one.
Detailed Explanation
Cascade impactors are specialized instruments designed to measure particle size distribution. They use a series of impactors to separate particles based on size. As air passes through each impactor, particles are captured on different levels, allowing researchers to analyze how many particles fall into each size category more precisely than simple samplers. This data is essential for understanding the behavior and health impacts of air pollution.
Examples & Analogies
You might think of a cascade impactor as a series of basketball nets of varying heights, where only balls of certain sizes can get through to the next stage. This helps us understand how many basketballs of varying sizes can make it through each net, similar to how we analyze air quality according to particle sizes.
Real-Time Monitoring Techniques
Chapter 8 of 8
🔒 Unlock Audio Chapter
Sign up and enroll to access the full audio experience
Chapter Content
So the blue line here indicates the real time data and the pink line indicates average, so I have an 8 hour average I have this concentration, 8 hour average, so 125, 130 or something, but I can see that throughout the day the concentration is going up to 300 and coming back down to 50 or 0.
Detailed Explanation
In this section, the importance and benefits of real-time monitoring of air pollutants are highlighted. Real-time data, shown as a blue line in the example, reveals fluctuations in concentration throughout the day. This detailed understanding can assist regulatory agencies to respond promptly to pollution peaks rather than relying solely on averaged data that might mask these spikes.
Examples & Analogies
Consider a stock market app that displays real-time data. While you can see the average price over the week, real-time tracking shows when sharp peaks or drops occur, allowing investors to make timely decisions. Similarly, real-time air quality monitoring can inform public health actions when pollution levels suddenly rise.
Key Concepts
-
Measurement Protocols: Defined methods for assessing pollutants.
-
High Volume Samplers: Instruments that collect substantial air samples.
-
PM10 vs PM2.5: Differentiation between particulate sizes and their health impacts.
-
Real-Time Monitoring: Immediate feedback on air quality data.
Examples & Applications
In urban settings, high-volume samplers may run for 8 hours to collect data on PM10, while in remote areas, samplers might be needed for up to 24 hours.
Real-time monitoring devices analyze air samples instantly, allowing for immediate regulatory actions in response to pollution spikes.
Memory Aids
Interactive tools to help you remember key concepts
Rhymes
For every pollutant you see, check the PM—2.5 or 10, that's the key!
Stories
Once in a town, air quality was low. Regulators checked PM levels, and their data began to flow: ‘With high-volume samplers, and real-time might, we’ll ensure our air stays clear and bright!’
Memory Tools
Remember PACE for measurement: Pollution levels, Available technology, Context, Equipment.
Acronyms
To remember PM sizes
'10 is bigger
2.5 is a digger!'
Flash Cards
Glossary
- Measurement Protocols
Standardized methods for assessing and quantifying pollutants.
- High Volume Samplers
Instruments that collect significant air volumes for particulate matter analysis.
- PM10
Particulate matter with a diameter of 10 micrometers or less.
- PM2.5
Particulate matter that is 2.5 micrometers or less in diameter.
- RealTime Monitoring
Continuous measurement of pollutants providing immediate data.
Reference links
Supplementary resources to enhance your learning experience.