
Emission Factor and Dispersion Problem
Enroll to start learning
You’ve not yet enrolled in this course. Please enroll for free to listen to audio lessons, classroom podcasts and take practice test.
Interactive Audio Lesson
Listen to a student-teacher conversation explaining the topic in a relatable way.
Emission Factors
🔒 Unlock Audio Lesson
Sign up and enroll to listen to this audio lesson

Today, we'll explore emission factors. Can anyone tell me what an emission factor is?

Isn't it the amount of pollutants released per unit of activity?
Exactly! You can define it as the estimate of emissions associated with a specific source. For our exercise, you’ll each pick three pollutants and retrieve their emission factors. Remember to look for reliable sources online.

How do we actually apply these factors in our calculations?
Great question! You will use these factors in the dispersion model, which we’ll delve into shortly. Let's summarize: A mnemonic to remember is 'Pollution Generates Emissions' (PGE) to help keep emission factor concepts in mind.
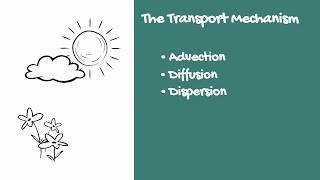
Mixing Length and Temperature
🔒 Unlock Audio Lesson
Sign up and enroll to listen to this audio lesson

Next, we'll estimate the mixing length. Can someone explain what the mixing length is?

Is it the height at which the atmosphere can effectively mix?
Correct! We will determine this based on the environmental and adiabatic lapse rates. How do we start?

By plotting the temperature profiles, right?
Absolutely! Remember: higher temperatures lead to a more stable atmosphere, while lower temperatures create instability. Now, let’s visualize our findings!
Gaussian Dispersion Equation
🔒 Unlock Audio Lesson
Sign up and enroll to listen to this audio lesson
Now we will dive into the Gaussian dispersion equation. What do you think is the significance of this equation?
It helps predict how pollutants spread in the atmosphere?
Yes, that's right! We’ll consider different distances and stability classes. How do you think height affects our calculations?
The concentration will vary depending on how far from the source we get?
Precisely! And don't forget to plot these concentrations to visualize how they change over distance. A simple acronym to remember is 'STAC' – Stability, Temperature, Area, and Concentration!
Introduction & Overview
Read summaries of the section's main ideas at different levels of detail.
Quick Overview
Standard
In this section, Prof. Krishna outlines exercises on determining emission factors for different pollutants and solving dispersion problems. Students will estimate mixing lengths graphically, calculate concentrations at various heights, and utilize the Gaussian dispersion equation to model pollutant dispersion based on given environmental conditions.
Detailed
Emission Factor and Dispersion Problem
This section of the chapter explores critical concepts associated with emission factors and dispersion modeling of pollutants in environmental contexts. The section begins with a tutorial directed at obtaining emission factors for three selected pollutants from a specified online source. These factors are crucial for subsequent calculations related to dispersion problems.
Key Concepts Covered:
- Mixing Length Estimation: Students will learn to estimate mixing lengths graphically based on environmental temperature and lapse rates, working towards a conclusion on mixing height.
- Gaussian Dispersion Equation: The exercise then transitions to solving a dispersion problem using the Gaussian dispersion equation, where students will estimate pollutant concentrations at various heights for different stability classes.
- Practical Application: By exploring how plume behavior varies as a function of distance (x) from the source, students will develop a nuanced understanding of pollutant behavior under different conditions.
Overall, the section emphasizes hands-on calculations, and it invites students to incorporate theoretical concepts into practical scenarios, highlighting the significance of these calculations in environmental engineering and risk assessment.
Youtube Videos


Audio Book
Dive deep into the subject with an immersive audiobook experience.
Introduction to Emission Factors
Chapter 1 of 5
🔒 Unlock Audio Chapter
Sign up and enroll to access the full audio experience
Chapter Content
Tutorial is to get emission factor. So, there are different categories I have already given in that. So, you can pick any 3 and go to the website that we talked about, pick the emission factor for any 3 different pollutants and then for those sources we do dispersion problem exercise.
Detailed Explanation
This section introduces the concept of emission factors, which are crucial for understanding how much of a pollutant is released into the environment. Students are instructed to select three pollutants from different categories and find their respective emission factors using a specified website. An emission factor quantifies the amount of a pollutant emitted per unit of activity or production, allowing for the calculation of total emissions based on various activities.
Examples & Analogies
Imagine you are monitoring the air quality in a city. By knowing the emission factors for different vehicles, you can estimate how much pollution is released into the air by all the cars on the road. It's like counting how many cookies you bake based on how much dough you use – the emission factor tells you how many 'cookies' (pollutants) come out based on the 'dough' (activity).
Understanding Mixing Length
Chapter 2 of 5
🔒 Unlock Audio Chapter
Sign up and enroll to access the full audio experience
Chapter Content
Before the dispersion problem, I have one exercise on estimation of mixing length. Here you have to determine graphically, the temperature at the ground T at z = 0 for the environment and T at z = 0 for the pollutant.
Detailed Explanation
This chunk focuses on the concept of mixing length, which is important for understanding how pollutants disperse in the atmosphere. Students are instructed to graphically determine the temperature of the environment and the pollutant at ground level. The environmental lapse rate (the rate at which temperature decreases with altitude) and the adiabatic lapse rate (the rate at which a rising air parcel cools) are key factors in calculating the mixing height, where the two temperatures intersect.
Examples & Analogies
Think of mixing two different colored paints. The height at which the colors start to blend together represents the mixing length. Similarly, in the atmosphere, the mixing height determines how far pollutants mix with surrounding air before they disperse.
Dispersion Problem Overview
Chapter 3 of 5
🔒 Unlock Audio Chapter
Sign up and enroll to access the full audio experience
Chapter Content
So, the next is a dispersion exercise. You start with the full form of the Gaussian dispersion equation with reflection... you have to calculate rho A1 at some height.
Detailed Explanation
In this part, students engage with a dispersion exercise where they utilize the Gaussian dispersion equation to model how pollutants spread in the atmosphere. The equation incorporates different parameters, including height (z), distance (x), and stability classes. Students must compute pollutant concentration at various heights and distances, reflecting how dispersion is affected by atmospheric conditions and the initial release height of the pollutants.
Examples & Analogies
Picture releasing a balloon filled with colored powder from a height. The way the powder spreads in the air can be predicted using the Gaussian dispersion model, which tells us how concentrations decrease with distance and height, similar to how the color spreads out from the balloon.
Visualizing Concentration Changes
Chapter 4 of 5
🔒 Unlock Audio Chapter
Sign up and enroll to access the full audio experience
Chapter Content
This is one exercise. When you are doing AERMOD, this is done automatically by the software...
Detailed Explanation
Students learn to visualize concentrations of pollutants at ground level over distance, especially noting that a higher stack can delay the detection of pollutants on the ground due to dispersion patterns. A plot can help visualize how concentration changes from zero at various distances until it reaches a peak as the plume descends.
Examples & Analogies
Imagine throwing confetti into the air from a tall balcony. At first, it seems like no confetti reaches the ground, but as it falls, it begins to accumulate in certain areas. Similarly, this dispersion exercise helps visualize how pollutants behave in the environment.
Using AERMOD Software
Chapter 5 of 5
🔒 Unlock Audio Chapter
Sign up and enroll to access the full audio experience
Chapter Content
You can set it up like that to do in Excel also provided you know equations for sigma y and sigma z.
Detailed Explanation
AERMOD is a regulatory model used for estimating pollutant concentrations. This part of the instructions guides students on configuring the model or using Excel to run calculations based on the Gaussian dispersion formula. Understanding the variables, like sigma y and sigma z (which represent the horizontal and vertical spread of the plume), is necessary for accurate modeling.
Examples & Analogies
Using Excel to run dispersion calculations can be similar to following a recipe in cooking – you have to measure the right ingredients (variables) to get the desired dish (pollutant concentration).
Key Concepts
-
Mixing Length Estimation: Students will learn to estimate mixing lengths graphically based on environmental temperature and lapse rates, working towards a conclusion on mixing height.
-
Gaussian Dispersion Equation: The exercise then transitions to solving a dispersion problem using the Gaussian dispersion equation, where students will estimate pollutant concentrations at various heights for different stability classes.
-
Practical Application: By exploring how plume behavior varies as a function of distance (x) from the source, students will develop a nuanced understanding of pollutant behavior under different conditions.
-
Overall, the section emphasizes hands-on calculations, and it invites students to incorporate theoretical concepts into practical scenarios, highlighting the significance of these calculations in environmental engineering and risk assessment.
Examples & Applications
If a factory emits 100 kg of CO2 per hour, its emission factor could be expressed in kg of CO2 emitted per megawatt-hour of energy produced.
In a Gaussian dispersion model, if we have a stack height of 100 meters and a wind speed of 3 m/s, we can calculate the pollutant concentration downwind at various distances.
Memory Aids
Interactive tools to help you remember key concepts
Rhymes
Pollution flows as we see, Emission factors guide with glee!
Stories
Imagine a lake where a factory's waste spills in. The lake, once crystal clear, now has hidden pollutants that disperse through the air, reminding us of the importance of monitoring emissions.
Memory Tools
Remember 'MDS' for Mixing, Dispersion, and Stability for environmental studies.
Acronyms
Use 'ACE' - Air, Concentration, Emission to remember the core components of pollution dispersion.
Flash Cards
Glossary
- Emission Factor
A quantitative estimate of emissions associated with a specific source or activity.
- Dispersion Problem
A modeling exercise to predict the spread of pollutants released into the atmosphere.
- Mixing Length
The height or depth over which atmospheric mixing occurs.
- Gaussian Dispersion Equation
A mathematical formula that estimates the concentration of pollutants over a given distance from the source.
Reference links
Supplementary resources to enhance your learning experience.