
Pyramid of Number
Enroll to start learning
You’ve not yet enrolled in this course. Please enroll for free to listen to audio lessons, classroom podcasts and take practice test.
Interactive Audio Lesson
Listen to a student-teacher conversation explaining the topic in a relatable way.
Understanding the Pyramid of Number
🔒 Unlock Audio Lesson
Sign up and enroll to listen to this audio lesson

Today we're diving into the Pyramid of Number! This concept helps us visualize the number of organisms in different trophic levels of an ecosystem. Can anyone tell me what a trophic level is?

Isn't it the level in the food chain like producers and consumers?
Exactly! At the base, we have the producers, like phytoplankton in a pond ecosystem. Why do you think they are always the most numerous?

Because they produce food for other organisms?
Right! They convert sunlight into energy, which is fundamental for the entire ecosystem. Now, what happens as we move up the pyramid to herbivores?

The numbers decrease, right? Like how there are more plants than animals.
Correct! The shape of the pyramid is upright in a pond but can be inverted in a forest. What does this tell us about those ecosystems?

Maybe it shows that in a forest, there are fewer trees than there are birds eating them?
Precisely! This illustrates the importance of understanding the ecological context of these pyramids. Let’s summarize: the Pyramid of Number shows the decreasing number of organisms at higher trophic levels.
Exploring the Pyramid of Biomass
🔒 Unlock Audio Lesson
Sign up and enroll to listen to this audio lesson

Now, let's move to the Pyramid of Biomass. Unlike the Pyramid of Number, this represents the total dry mass of organisms at each level. What do you think happens to biomass as we go up a pyramid?
It decreases because there are fewer animals at the top.
Exactly! In a grassland ecosystem, the pyramid is upright. But in a pond, it can be inverted. What do you think that means?
That the algae are heavier or have less biomass than the fish?
Great observation! This shows how energy dynamics can vary across ecosystems. As we know, the energy pyramid always gives us a clear view of the ecosystem structure.
So energy transfer is more consistent than numbers or biomass?
Right! The Pyramid of Energy remains upright, indicating energy loss at each trophic step. Let’s recap: the Pyramid of Biomass reflects the weight distribution, and we see variations in different ecosystems.
Introduction & Overview
Read summaries of the section's main ideas at different levels of detail.
Quick Overview
Standard
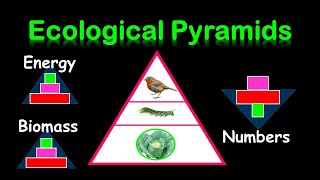
In this section, we explore the Pyramid of Number, the Pyramid of Biomass, and the Pyramid of Energy, assessing how each reflects the ecological structure of various ecosystems. The concepts are exemplified through pond and forest ecosystems, highlighting the variability in these pyramids and their implications in ecological studies.
Detailed
Pyramid of Number
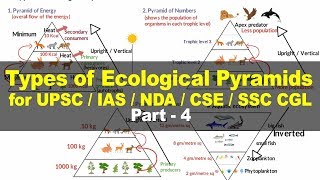
The Pyramid of Number is a graphical representation that depicts the number of organisms at each trophic level within an ecosystem. Producers, primarily phytoplankton in aquatic systems or trees in terrestrial systems, are typically at the base of the pyramid and are the most abundant. As we move up the pyramid to herbivores and then to carnivores, there is a notable decrease in the number of organisms, resulting in an upright shape in a pond ecosystem but an inverted shape in a forest ecosystem. This discrepancy highlights that the Pyramid of Number, while useful, may not accurately represent the complexity of food chains.
Additionally, we discuss the Pyramid of Biomass, which illustrates the biomass at each level, and the Pyramid of Energy, the most informative pyramid, showing energy availability and transfer between trophic levels. Understanding the structure and function of these pyramids is crucial for studying ecosystem dynamics.
Youtube Videos


Audio Book
Dive deep into the subject with an immersive audiobook experience.
Definition and Purpose
Chapter 1 of 4
🔒 Unlock Audio Chapter
Sign up and enroll to access the full audio experience
Chapter Content
•They show the relationship between producers, herbivores, and carnivores at successive tropic levels in terms of their number.
Detailed Explanation
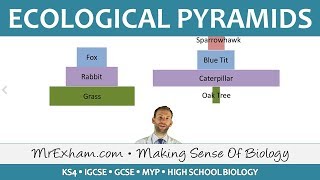
The Pyramid of Number is an ecological concept that illustrates how different types of organisms are distributed at various levels of a food chain. In this pyramid, the base consists of producers (like plants), followed by herbivores (primary consumers), and apex predators (carnivores). The diagram usually displays the number of individuals at each trophic level, providing insights into the relationships between these groups.
Examples & Analogies
Think of a pyramid as a party where different groups of guests are represented at each level. Large groups of producers (like plants) are at the base, followed by smaller groups of herbivores (like rabbits) in the middle, and the smallest group of top predators (like wolves) at the top. This shows how energy and nutrients are distributed among them.
Upright Pyramid in Pond Ecosystem
Chapter 2 of 4
🔒 Unlock Audio Chapter
Sign up and enroll to access the full audio experience
Chapter Content
•In case of pond ecosystem the producers are mainly phytoplankton and are always maximum in number this number then shows a decrease towards apex as primary consumers are zooplanktons are lesser in number than phytoplankton, the secondary consumers are large fish are even lesser in number than the phytoplankton. Thus the shape of pyramid is upright.
Detailed Explanation
In a pond ecosystem, the base of the pyramid is formed by phytoplankton, which are tiny photosynthetic organisms. They are abundant because they can produce their own food using sunlight. As we move up to herbivores, like zooplankton, their numbers decrease. Finally, large fish, which are the carnivores, are even fewer in number. This gradual decrease creates an upright pyramid shape, representing how energy flows from the producers to the predators.
Examples & Analogies
Imagine a classroom with many students (phytoplankton) at the bottom, some teachers (zooplankton) in the middle, and just a few administrators (large fish) at the top. As you go up, the number decreases, similar to an organization's hierarchy.
Inverted Pyramid in Forest Ecosystem
Chapter 3 of 4
🔒 Unlock Audio Chapter
Sign up and enroll to access the full audio experience
Chapter Content
But in case of forest ecosystem the pyramids is always inverted because the producers are mainly large trees, are lesser in numbers, the herbivores fruit eating birds are more in number than the producers, then there is gradual decrease in number of secondary consumers thus making pyramid upright again.
Detailed Explanation
In a forest, the situation reverses. The producers, which are large trees, are fewer in number compared to the numerous fruit-eating birds (herbivores) that feed on them. This results in an inverted pyramid, where the base is narrower than the middle. However, as we include secondary consumers, such as various predators that feed on the birds, their numbers decrease, which can eventually lead to an upright pyramid shape as we look at the overall structure of the ecosystem.
Examples & Analogies
Imagine a fruit tree in an orchard; there are far fewer trees than the apples it produces. Many birds come to eat those apples. Therefore, the number of birds might be more than the trees, leading to an unconventional pyramid where the base is smaller.
Limitations of the Pyramid of Number
Chapter 4 of 4
🔒 Unlock Audio Chapter
Sign up and enroll to access the full audio experience
Chapter Content
Thus the pyramid of number does not give a true picture of the food chain and are not very functional.
Detailed Explanation
While the Pyramid of Number provides a visual representation of the number of organisms at each level of the food chain, it does not accurately represent the energy flow or biomass. In some ecosystems, the number of organisms can be misleading—large trees may support many small organisms, but because they are few in number, the pyramid can look disproportionate. Thus, while informative, it does not give a complete picture of the ecological dynamics.
Examples & Analogies
It's like counting the number of students in a school without considering how many classes or grades they represent. A single class with many students might look bigger than an entire school with fewer classes. This perspective misses the overall structure and details of the system.
Key Concepts
-
Pyramid of Number: Visual representation of organism numbers in ecosystems.
-
Pyramid of Biomass: Reflects the total dry mass at each trophic level.
-
Pyramid of Energy: Shows the flow of energy through an ecosystem.
Examples & Applications
In a grassland ecosystem, the upright pyramid shows a high number of producers like grass compared to fewer herbivores and even fewer carnivores.
In a forest ecosystem, the inverted pyramid indicates fewer trees as compared to a larger number of herbivores like birds.
Memory Aids
Interactive tools to help you remember key concepts
Rhymes
In the pyramid tall, with levels we see, Producers abound, down to one at the peak, as we climb up, numbers decline quick!
Stories
Imagine a great forest where trees and birds interact; the mighty trees stand tall as the base, but fewer birds find space to flap their wings.
Memory Tools
PEB (Pyramid of Energy, Biomass, Number) helps us remember different pyramids in ecology.
Acronyms
To recall the pyramids, think P-E-N
Pyramid of Energy
Pyramid of Number.
Flash Cards
Glossary
- Trophic Level
Each step in a food chain or food web where organisms share the same function in the ecosystem.
- Producers
Organisms that synthesize their own food from sunlight or chemical sources, forming the base of the food chain.
- Biomass
The total mass of living matter within a given unit area.
- Pyramid of Energy
A model that shows the flow of energy through each trophic level in an ecosystem.
Reference links
Supplementary resources to enhance your learning experience.