
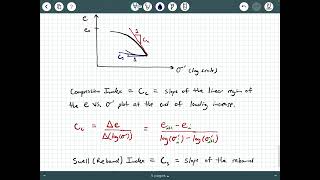
Figure: e – log σ ’ plot
Enroll to start learning
You’ve not yet enrolled in this course. Please enroll for free to listen to audio lessons, classroom podcasts and take practice test.
Interactive Audio Lesson
Listen to a student-teacher conversation explaining the topic in a relatable way.
Introduction to the e – log σ' Plot
🔒 Unlock Audio Lesson
Sign up and enroll to listen to this audio lesson

Today, we'll discuss the e – log σ' plot, which is essential for visualizing the relationship between void ratio and effective stress in soils.

What's the significance of the void ratio in this context?
Great question! The void ratio (e) indicates how much empty space exists in a given volume of soil, impacting its compressibility. Remember, **e** stands for **empty**.

And what about the effective stress?
Effective stress (σ') is crucial because it defines the stress that contributes to soil strength and deformation. Think of it as the stress that effectively acts on the soil skeleton.

How do we plot this information though?
Good point! The plot typically has void ratio on the y-axis and effective stress on the x-axis. The resulting curve helps us visualize how soils compress under different loads.

Can you summarize the key points again?
Certainly! We covered the definitions of void ratio and effective stress and their relationship on the e – log σ' plot, which is vital for predicting soil behavior under loads.
Understanding the Swelling Index (C)
🔒 Unlock Audio Lesson
Sign up and enroll to listen to this audio lesson

Next, let’s talk about the swelling index (C) and how it influences the e – log σ' plot. This index plays a significant role in our understanding of soil compressibility.
What exactly is the swelling index?
The swelling index (C) measures the change in void ratio with changes in effective stress, particularly relevant when soil experiences hydration or dehydration. Remember, **C means Change**!
How does that affect the plot?
A higher swelling index indicates more change in void ratio, significantly impacting our predictions regarding soil expansion and contraction.
So, if we know the swelling index, we can better predict soil behavior?
Exactly! Analyzing the swelling index alongside the e – log σ' plot allows for better engineering decisions in soil management.
Can we sum it up?
Sure! We discussed the definition of the swelling index and its importance for understanding soil compressibility and its representation in the e – log σ' plot.
Introduction & Overview
Read summaries of the section's main ideas at different levels of detail.
Quick Overview
Standard
The e – log σ' plot represents the relationship between the void ratio (e) and the effective stress (σ') in soil mechanics, crucial for analyzing compressibility properties. This section emphasizes the significance of the swelling index (C) and strategies for interpreting the data represented in the plot.
Detailed
Detailed Summary
The e – log σ' plot is a fundamental tool in geotechnical engineering that visually represents the relationship between the void ratio (e) and effective stress (σ') experienced by soil. This plot is instrumental in understanding the compressibility properties of soils, clarifying how their structure changes under varying stress conditions. The importance of the swelling index (C), which aids in predicting how soils will behave when they undergo changes in moisture content, is also highlighted within this section. An appreciation for this graphical representation allows engineers to make informed decisions about soil behaviors under load, contributing to effective design and construction practices.
Youtube Videos


Audio Book
Dive deep into the subject with an immersive audiobook experience.
Introduction to the e – log σ ’ Plot
Chapter 1 of 3
🔒 Unlock Audio Chapter
Sign up and enroll to access the full audio experience
Chapter Content
The e – log σ ’ plot is a graphical representation commonly used in the study of compressibility properties.
Detailed Explanation
The e – log σ ’ plot is a type of graph where the x-axis typically represents the logarithm of a variable (often stress or σ'), and the y-axis represents another variable (such as void ratio or a feature linked to compressibility). This plot is essential for visualizing how materials behave under varying conditions. Understanding the shape of this plot helps in predicting the material's response to different loads.
Examples & Analogies
Think of a sponge in water. When you start pressing down on it (applying stress), the amount of water it holds (void ratio) changes. The e – log σ ’ plot helps us see that relationship clearly on a graph, just like a pressure gauge helps us see how much air is in a tire.
Understanding the Axes
Chapter 2 of 3
🔒 Unlock Audio Chapter
Sign up and enroll to access the full audio experience
Chapter Content
The plot’s axes help us analyze the relationship between stress and compressibility.
Detailed Explanation
On the e – log σ ’ plot, the x-axis represents the logarithmic scale of stress (σ’), while the y-axis typically indicates some property related to volume change or compressibility. The logarithmic scale is useful in engineering because it allows for a wide range of values to be displayed compactly. When you look at the individual points on this graph, you can see how a small increase in stress can lead to a significant decrease in volume, emphasizing the material's compressibility.
Examples & Analogies
Consider how a balloon behaves. When you apply a little pressure, the balloon compresses a bit but still holds its shape well. If you apply too much pressure, however, it can pop. The e – log σ’ plot would allow you to visualize these changes in a very practical way.
Applications of the e – log σ ’ Plot
Chapter 3 of 3
🔒 Unlock Audio Chapter
Sign up and enroll to access the full audio experience
Chapter Content
This figure holds significant importance in engineering and material sciences.
Detailed Explanation
Engineers and scientists use the e – log σ ’ plot to assess the suitability of materials for construction, among other applications. For instance, evaluating soil behavior during load application provides crucial insight for designing foundations and other structures. The data obtained from these plots helps in understanding how much a material will compress when subjected to stress over time, which is vital for ensuring stability and safety.
Examples & Analogies
Imagine building a house on sandy soil. Before construction, builders would use the e – log σ' plot to ensure that the soil can handle the weight of the house without collapsing or settling too much. This is similar to ensuring a bridge can hold the weight of traffic without sagging.
Key Concepts
-
e – log σ' plot: A graphical representation of the relationship between void ratio and effective stress.
-
Void Ratio: An important factor in determining soil compressibility.
-
Effective Stress: Critical for understanding soil strength and behavior.
-
Swelling Index (C): Key to predicting changes in soil volume.
Examples & Applications
For instance, if a soil sample exhibits a high void ratio, it will likely compress more under an increased load represented on the e – log σ' plot.
A real-world scenario might involve predicting the behavior of expansive clay in response to moisture changes, where the swelling index is particularly critical.
Memory Aids
Interactive tools to help you remember key concepts
Rhymes
e and σ', watch them plot, helps with soil stress, like a perfect shot!
Stories
Once there was a soil engineer who plotted e against σ'. The clearer the graph, the happier the result, guiding him in every moisture-filled fault.
Memory Tools
Remember 'VEST' for Void ratio, Effective stress, Swelling index and their relation.
Acronyms
C for Change helps you remember the Swelling Index.
Flash Cards
Glossary
- Void Ratio (e)
The ratio of the volume of voids to the volume of solids in a soil.
- Effective Stress (σ')
The stress that contributes to soil strength, calculated by the total stress minus pore water pressure.
- Swelling Index (C)
A measure that describes the change in void ratio in response to changes in effective stress.
Reference links
Supplementary resources to enhance your learning experience.