
Visual Communication in Hardware Design
Interactive Audio Lesson
Listen to a student-teacher conversation explaining the topic in a relatable way.
Importance of Visual Communication
🔒 Unlock Audio Lesson
Sign up and enroll to listen to this audio lesson

Today, we're going to explore the significance of visual communication in hardware design. Why do you think it's important to represent designs visually?

Because it helps clarify complex information?
Exactly! Visuals like diagrams and charts can convey information more efficiently than text alone. Can anyone mention a specific tool used in visual communication?

How about block diagrams?

Or schematic diagrams that show how components connect?
Great examples! Block diagrams help illustrate the architecture, while schematic diagrams depict electrical connections. Remember: **‘BDS’** for Block Diagrams and Schematic diagrams. Any questions on these tools?
Types of Visual Tools
🔒 Unlock Audio Lesson
Sign up and enroll to listen to this audio lesson

Let’s dive deeper into the types of visual tools. What do block diagrams typically illustrate?

They show the overall system architecture!
Correct! They give a broad view of how the system operates. Now, what role does a PCB layout play?
It shows the design of the actual circuit board.
That's right! Think of it as the blueprint for manufacturing. How about timing diagrams?
They visualize the timing of signals in the system?
Absolutely! This can help in troubleshooting timing issues. Let’s summarize - **'BPTS'**: Block diagrams for architecture, PCB layouts for design, Timing diagrams for signals, and Schematic for connectivity. Any questions?
Using Visual Tools for Communication
🔒 Unlock Audio Lesson
Sign up and enroll to listen to this audio lesson
In presentations, how can we ensure we effectively use these visual tools?
We should keep slides clean and not too text-heavy, right?
Exactly! Focusing on visuals can keep audiences engaged. What’s another key aspect?
Using clear labels for diagrams and charts?
Spot on! Clarity in labeling helps avoid confusion. Let’s remember: **‘CLEF’** for Clean, Labels, Engage, Focus. How do you think these tools aid different audiences?
Engineers need detail, but managers prefer high-level overviews.
Exactly, tailoring visuals for the audience is essential! Let’s recap: Effective visuals are clean, clearly labeled, and engaging. Who can summarize the key types of visual aids we discussed?
Introduction & Overview
Read summaries of the section's main ideas at different levels of detail.
Quick Overview
Standard
In hardware design, effective visual communication is achieved through tools like block diagrams, schematics, and timing charts that help illustrate the system architecture, component connectivity, and performance data. These visual tools are vital for clarity and understanding among diverse stakeholders.
Detailed
Visual Communication in Hardware Design
In the realm of hardware design, visual communication plays a pivotal role in ensuring that complex concepts are conveyed clearly and understandably. This section emphasizes various visual tools utilized in hardware engineering, including:
- Block Diagrams: These illustrate the system architecture and flow, allowing engineers and stakeholders to grasp the overall structure at a glance.
- Schematic Diagrams: Essential for depicting electrical connectivity and the relationships between components, these diagrams serve as the backbone of hardware system design documentation.
- PCB Layouts: Presenting a detailed overview of the board design, footprints, and routing pathways, PCB layouts are crucial for manufacturers during the production phase.
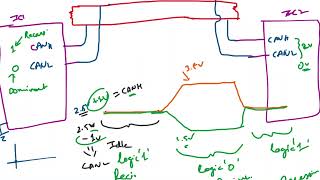
- Timing Diagrams: These diagrams visualize the timing of logic and data communications, which is necessary for understanding system behavior over time.
- Charts and Graphs: Used for presenting performance metrics, power consumption, or thermal data, these graphical representations make complex data more digestible.
Understanding and utilizing these visual communication tools not only enhance the design process but also facilitate better collaboration among engineers, managers, and clients.
Youtube Videos

Audio Book
Dive deep into the subject with an immersive audiobook experience.
Block Diagrams
Chapter 1 of 5
🔒 Unlock Audio Chapter
Sign up and enroll to access the full audio experience
Chapter Content
Block Diagrams Show system architecture and flow
Detailed Explanation
Block diagrams provide a high-level representation of a system, indicating the main components and their interactions. They help to visualize how different parts of a system connect and communicate, making it easier to understand complex designs.
Examples & Analogies
Imagine a city map where major roads and landmarks are shown. A block diagram is like that map for a hardware system—it highlights key components like processors, memory, and their interconnections without getting bogged down in the details.
Schematic Diagrams
Chapter 2 of 5
🔒 Unlock Audio Chapter
Sign up and enroll to access the full audio experience
Chapter Content
Schematic Represent electrical connectivity and components
Detailed Explanation
Schematic diagrams represent the electrical connections within a hardware design. Each component is represented by a symbol, and lines show how they are connected either physically or via electrical signals. This is crucial for understanding how different parts of the circuit will operate together.
Examples & Analogies
Think of a schematic diagram as a recipe for a meal. Just as a recipe lists ingredients and their quantities, a schematic shows each component and how they fit together—essential for ensuring everything works as intended.
PCB Layouts
Chapter 3 of 5
🔒 Unlock Audio Chapter
Sign up and enroll to access the full audio experience
Chapter Content
PCB Layouts Present board design, footprint, and routing
Detailed Explanation
PCB layouts depict the physical arrangement of components on a printed circuit board. They include the dimensions, positions, and connection routes needed to properly integrate each part. A well-designed layout minimizes interference and optimizes performance.
Examples & Analogies
Imagine arranging furniture in a room. A PCB layout is like planning the best use of space, ensuring that everything fits well together and that there's a clear path for movement—here, the signals between components.
Timing Diagrams
Chapter 4 of 5
🔒 Unlock Audio Chapter
Sign up and enroll to access the full audio experience
Chapter Content
Timing Diagrams Visualize logic and data communication timing
Detailed Explanation
Timing diagrams are used to represent the timing relationships between signals in a system. They show how signals change over time and their interactions, which is important for understanding synchronization and ensuring that signals are correctly timed.
Examples & Analogies
Consider a traffic light sequence in a busy intersection. A timing diagram would illustrate when each light changes color and how they interact, much like how different signals in a hardware system need to coordinate to function properly.
Charts and Graphs
Chapter 5 of 5
🔒 Unlock Audio Chapter
Sign up and enroll to access the full audio experience
Chapter Content
Charts/Graphs Present performance, power, or thermal data
Detailed Explanation
Charts and graphs are visual tools that help represent data such as performance metrics, power consumption, or thermal characteristics in a way that's easy to interpret. They allow engineers to quickly gauge system behavior and make comparisons.
Examples & Analogies
Think of a chart as a fitness tracker displaying your daily steps and active minutes. Just like the tracker helps you visualize your activity levels at a glance, charts and graphs help engineers visualize the critical performance data of hardware systems.
Key Concepts
-
Visual Tools: Essential for conveying complex information clearly.
-
Block Diagrams: Used to illustrate system architecture and relationships.
-
Schematic Diagrams: Key for showing electrical connections and layout.
-
PCB Layouts: Provide a detailed visual representation of circuit board arrangements.
-
Timing Diagrams: Important for visualizing timing relationships in digital circuits.
Examples & Applications
A block diagram illustrating the flow of power within a power management system.
A schematic diagram showing various components (resistors, capacitors, ICs) connected in a circuit.
Memory Aids
Interactive tools to help you remember key concepts
Rhymes
To show a flow, just draw a block, / For connections, a schematic will rock!
Stories
Imagine a town where the roads (block diagrams) connect various neighborhoods (components). The schematics are the maps that show exactly where each road meets another.
Memory Tools
Remember 'BPTS' for Block diagrams, PCB layouts, Timing diagrams, and Schematic diagrams.
Acronyms
Use **'CRISP'** to recall
Clear
Relevant
Informative
Specific
and Proportionate when creating charts.
Flash Cards
Glossary
- Block Diagram
A visual representation that illustrates the overall architecture and flow of a system.
- Schematic Diagram
A diagram that provides a symbolic representation of the electrical connectivity between components.
- PCB Layout
A detailed design plan showing the arrangement of various components on a printed circuit board.
- Timing Diagram
A graphical representation that visualizes the timing relationships between signals in a digital circuit.
- Charts/Graphs
Visual representations of data that facilitate understanding of performance metrics, power usage, or thermal data.
Reference links
Supplementary resources to enhance your learning experience.