
Interpreting Maps and Globes
Enroll to start learning
You’ve not yet enrolled in this course. Please enroll for free to listen to audio lessons, classroom podcasts and take practice test.
Interactive Audio Lesson
Listen to a student-teacher conversation explaining the topic in a relatable way.
Map Basics
🔒 Unlock Audio Lesson
Sign up and enroll to listen to this audio lesson

Today, we're diving into the basics of interpreting maps. Can anyone tell me what they think a map is?

A map shows different places and features, right?
Exactly! But more specifically, a map is a two-dimensional representation of Earth's surface. It includes several key elements such as the title, scale, legend, compass rose, and a latitude and longitude grid that help us navigate and understand geographical information.

What does each of those elements do?
Good question! The *title* tells what the map represents, the *scale* shows the relationship between map distance and real-world distance, the *legend* explains the symbols used, the *compass rose* indicates directions, and the *grid* uses latitude and longitude for pinpointing locations. Memorize it with the acronym **T-S-L-C-G**: Title, Scale, Legend, Compass rose, Grid!

So, T for title and S for scale. That makes it easier to remember!
Exactly! Let's summarize: Maps are essential tools with key elements that provide information about places. Understanding their basics helps us become better geographers.
Types of Maps
🔒 Unlock Audio Lesson
Sign up and enroll to listen to this audio lesson

Now let’s delve into the different types of maps. Who can tell me the classifications of maps?

I think there are physical maps and political maps.
Correct! There are four main types of maps: physical, political, thematic, and topographic maps. Can you describe a physical map?
It shows features like mountains and rivers!
Exactly! A physical map displays natural features. Political maps show borders and major cities. Thematic maps focus on a particular theme, such as climate or population density. Finally, topographic maps use contour lines to represent the shape of the land. Does anyone have a favorite type of map?
I like thematic maps because they focus on interesting data!
Great point! Each type of map offers different insights, which is valuable for geographical interpretation.
Using a Globe
🔒 Unlock Audio Lesson
Sign up and enroll to listen to this audio lesson
Next, let’s talk about globes. Why do you think a globe is helpful?
It’s a 3D representation, so it shows how things really are!
Exactly! A globe preserves Earth's shapes and distances accurately. This is beneficial, especially when we consider Earth's curvature. It helps us understand how continents relate to each other.
I heard globes show great-circle routes too?
Yes! Great-circle routes are the shortest paths between two points on a sphere, really useful for air travel. Globes give us a more accurate understanding of geography compared to flat maps.
I think I prefer using a globe now!
Remember, while globes are accurate, they're not always practical for every situation, which is where maps come back into play.
Basic GIS Principles
🔒 Unlock Audio Lesson
Sign up and enroll to listen to this audio lesson
Finally, let’s look at Basic GIS Principles. Who can explain what GIS stands for?
Does it mean Geographic Information Systems?
Very good! GIS is a powerful tool that combines various types of spatial data for analysis. Can anyone think of how it might be used?
Maybe for urban planning?
Exactly! By overlaying layers of data, planners can visualize land use, population density, and elevation at once. Let’s remember the key terms **Overlay, Scale, and Coordinate Systems** to grasp GIS better!
I like the way it helps make sense of all types of data together!
That's right! Combining layers allows for informed decision-making that addresses present and future needs. Excellent discussions today!
Introduction & Overview
Read summaries of the section's main ideas at different levels of detail.
Quick Overview
Standard
In this section, students learn about the essential elements of maps and globes, including types, scales, and the significance of GIS principles. Through various tools, they will reconstruct geography's physical and human aspects while developing critical spatial-analysis skills.
Detailed
Detailed Summary
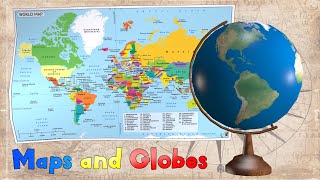
The section focuses on two-dimensional representations of Earth's surface through maps and three-dimensional models known as globes. Key components include:
- Map Basics: Understanding maps involves knowing their title, purpose, scale, legend, compass rose, and the latitude and longitude grid. Each element conveys essential data about a region's physical and human-made features.
- Types of Maps: Maps can be classified into four primary types—physical maps reflecting natural features, political maps showing boundaries, thematic maps highlighting specific themes (e.g., population density), and topographic maps indicating elevation changes through contour lines.
- Using a Globe: Globes provide an accurate portrayal of Earth, preserving its true shapes and distances, which help in visualizing Earth's curvature and relative positioning of cities and continents.
- Basic GIS Principles: Geographic Information Systems combine various spatial data layers to facilitate analysis—a tool that is increasingly relevant in urban planning and environmental management. Key practices in GIS include overlaying layers for pattern identification, understanding map scales, and employing coordinate systems.
Overall, mastering these geographic tools is vital for analyzing and interpreting spatial data effectively.
Youtube Videos
Audio Book
Dive deep into the subject with an immersive audiobook experience.
Map Basics
Chapter 1 of 4
🔒 Unlock Audio Chapter
Sign up and enroll to access the full audio experience
Chapter Content
A map is a two-dimensional representation of Earth’s surface. Maps use symbols, colors, and lines to display physical and human-made features. Common elements include:
1. Title and Purpose: Describes what the map shows (e.g., “World Physical Map,” “Population Density of Region X”).
2. Scale: The relationship between a distance on the map and the actual distance on Earth (for example, 1 cm = 10 km).
3. Legend (Key): Explains the meaning of symbols and colors used.
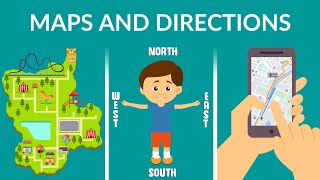
4. Compass Rose: Indicates cardinal directions (North, South, East, West).
5. Latitude and Longitude Grid: A system of imaginary lines used to identify precise locations.
Detailed Explanation
Maps are essential tools in geography that help us understand the world around us. A map represents the Earth in a two-dimensional way, allowing us to see various features without physically traveling there. The title lets us know what the map is about, while the scale helps us to measure real distances. For instance, if a map has a scale of 1 cm equals 10 km, we can figure out how far apart two places are by measuring their distance on the map and then calculating it based on the scale. The legend identifies what different colors and symbols represent, making the map easier to read. The compass rose shows directions (North, South, East, West), which is vital for navigation. Lastly, a grid of latitude and longitude lines helps pinpoint exact locations on the globe, using coordinates like 34° N and 118° W for Los Angeles.
Examples & Analogies
Think of a map like a treasure map in a story. The title tells you where the treasure is hidden. The scale shows how far you need to walk to find it, while the legend explains symbols (like an 'X' for the treasure location). The compass rose tells you which direction to go, and the latitude and longitude grid can help hunters find the treasure’s exact spot!
Types of Maps
Chapter 2 of 4
🔒 Unlock Audio Chapter
Sign up and enroll to access the full audio experience
Chapter Content
- Physical Maps: Show natural features such as mountains, rivers, and deserts.
- Political Maps: Display borders of countries, states, and major cities.
- Thematic Maps: Focus on a specific theme (e.g., climate zones, population density, vegetation).
- Topographic Maps: Use contour lines to represent elevation and land-shape changes.
Detailed Explanation
Maps come in different types, each serving a unique purpose. Physical maps highlight the natural landscape, showing mountains, rivers, and other geographical features so viewers can understand the topography (the arrangement of the natural and artificial physical features of an area). Political maps are used to illustrate boundaries between different political units such as countries and cities. Thematic maps emphasize specific data or themes and help provide focused information like climate patterns or population statistics. Lastly, topographic maps are particularly useful for hikers and land planners because they illustrate changes in elevation through contour lines. These lines connect points of equal elevation, making it easy to visualize terrain changes.
Examples & Analogies
If you were exploring a new area, a physical map would help you find hiking paths over hills and rivers. If you wanted to know where you could enter a new country, a political map would show you where the borders are. A thematic map could help you see which areas are ideal for farming by showing soil types, while a topographic map would tell you how steep the hiking trails are, allowing you to prepare for your expedition.
Using a Globe
Chapter 3 of 4
🔒 Unlock Audio Chapter
Sign up and enroll to access the full audio experience
Chapter Content
A globe is a three-dimensional model of Earth, preserving accurate shapes, areas, and distances. It is especially helpful for understanding:
1. Earth’s Curvature: Which causes distortion when a flat map is created.
2. Relative Positioning: How continents and oceans lie in relation to one another.
3. Great-Circle Routes: The shortest path between two points on a sphere (useful for air travel planning).
Detailed Explanation
Globes provide a realistic representation of our planet, unlike flat maps which can distort size and shape due to their two-dimensional nature. The globe's curvature allows for a more accurate visualization of distances and shapes of continents and oceans. This is crucial for understanding geography practically. For example, you can see that while a flat map might show Greenland as large, it's actually much smaller in comparison to Africa. Understanding relative positioning of the continents and oceans helps us conceptualize how far apart these land masses are, which is essential for navigation and geographical literacy. Additionally, great-circle routes are important for air travel, as they represent the shortest path between two points on the globe, helping airlines save fuel and time.
Examples & Analogies
Using a globe is like looking at Earth in 3D, like it's meant to be seen, much like viewing a 3D model instead of a flat picture of it—much clearer and gives you a better idea of how far destinations really are. Imagine planning a vacation; you would prefer to use a globe to quickly determine that flying from New York to London is much shorter than it seems on a map if you take great-circle routes, rather than flying way north around Canada.
Basic Geographic Information Systems (GIS) Principles
Chapter 4 of 4
🔒 Unlock Audio Chapter
Sign up and enroll to access the full audio experience
Chapter Content
Although full GIS software is complex, the basic idea is combining layers of spatial data (for example, elevation, land use, population) to analyze relationships. In IB Grade 8, you will practice:
1. Overlaying Layers: Visually comparing a physical map (landforms) with a human map (population distribution) to identify patterns.
2. Scale and Resolution: Understanding that large-scale maps (e.g., 1:10 000) show small areas in great detail, while small-scale maps (e.g., 1:1 000 000) cover larger areas but with less detail.
3. Coordinate Systems: Using latitude (horizontal lines) and longitude (vertical lines) to pinpoint locations (e.g., 34° N, 118° W is Los Angeles).
Detailed Explanation
Basic GIS principles focus on how we can utilize technology to analyze different geographical aspects by layering information. You might overlay a physical map showing mountains and valleys with a map showing where people live to see how geography influences human settlement patterns. Understanding scale is important; for instance, a small-scale map gives a broader view of a region but lacks detail. Knowing large-scale maps, like those used in city planning, can help in making detailed decisions about community developments. Finally, coordinate systems allow for exact pinpointing of locations on Earth—knowledge that's crucial for navigation, mapping, and many scientific applications.
Examples & Analogies
Using GIS is like putting together a puzzle where each piece represents different information. When you place the pieces together, you see how everything fits. For instance, if you're trying to find the best place to build a new park, you can layer maps showing where people live (population) and where the land is available (land use) on top of each other to find the ideal spot—like finding the perfect piece to complete your landscape puzzle!
Key Concepts
-
Map Basics: Essential elements such as title, scale, legend, compass rose, latitude and longitude.
-
Types of Maps: Categories including physical, political, thematic, and topographic maps.
-
Globe: A three-dimensional representation of Earth for accurate spatial understanding.
-
GIS Principles: Combining layers of spatial data to analyze spatial relationships.
Examples & Applications
A political map indicating state borders and major cities such as New York and Chicago.
A physical map showcasing the Rocky Mountains and the Mississippi River.
Memory Aids
Interactive tools to help you remember key concepts
Rhymes
Maps guide us near and far, with scales to know how big they are.
Stories
Imagine a traveler named Alex, who once got lost. He learned to read maps and understood scales, legends, and how directions worked on a compass rose. His journeys became smoother, all thanks to understanding the basic map elements.
Memory Tools
Remember T-S-L-C-G: Title, Scale, Legend, Compass rose, Grid as the essentials of every map!
Acronyms
MAPS
**M**easure
**A**nalyze
**P**resent
**S**how. This can help you remember what maps do!
Flash Cards
Glossary
- Map
A two-dimensional representation of Earth’s surface that uses symbols, colors, and lines.
- Scale
The ratio of a distance on a map to the actual distance on Earth.
- Legend (Key)
A part of a map that explains the meaning of symbols and colors used.
- Compass Rose
A symbol on a map that shows the directions (North, South, East, West).
- Latitude
Imaginary lines that run horizontally, measuring the distance north or south of the Equator.
- Longitude
Imaginary lines that run vertically, measuring the distance east or west of the Prime Meridian.
- Physical Map
A type of map that displays natural features such as mountains and rivers.
- Political Map
A map that shows borders of countries, states, and major cities.
- Thematic Map
A map that focuses on specific themes, such as climate or population density.
- Topographic Map
A map that uses contour lines to represent elevation and landform shapes.
- GIS (Geographic Information Systems)
Computer-based systems used to analyze and display geographic data.
Reference links
Supplementary resources to enhance your learning experience.