
Cooling Curve
Enroll to start learning
You’ve not yet enrolled in this course. Please enroll for free to listen to audio lessons, classroom podcasts and take practice test.
Interactive Audio Lesson
Listen to a student-teacher conversation explaining the topic in a relatable way.
Introduction to Cooling Curves
🔒 Unlock Audio Lesson
Sign up and enroll to listen to this audio lesson

Today, we're learning about cooling curves. A cooling curve is a graph that shows how a temperature changes over time as a substance cools. Can anyone tell me what they think happens to a substance's temperature when it cools?

I think the temperature decreases as it loses heat.
Exactly! And what's interesting is that there are specific areas on this graph where the temperature doesn't change, even though heat is being lost. Can anyone guess why this occurs?

Maybe because it’s changing from one state to another, like liquid to solid?
Great observation! Those flat sections are called plateaus, and they represent phase changes where heat is used to change the state instead of the temperature.

So, the temperature stays the same during those changes?
Correct! Remember this mnemonic: 'Plateaus Pause!' It reminds us that during phase changes, temperature remains constant.

What happens in between those plateaus?
Good question! Between the plateaus, the curve slopes downwards, indicating that the temperature of the substance is decreasing continuously.
To summarize, cooling curves show us both the phase changes where the temperature plateaus and the cooling phases where the temperature changes. It's a key concept for understanding thermal processes!
Reading Cooling Curves
🔒 Unlock Audio Lesson
Sign up and enroll to listen to this audio lesson

Let's look at a specific cooling curve now. What do you notice about the sections where the curve flattens?
Those parts are flat, showing that the temperature stays constant.
Exactly! Those are the phase change areas, like melting or boiling. Can anyone identify what happens before and after these flat sections?
Before the plateau, the temperature is dropping until it reaches the melting point.
Exactly! And after the phase change, the curve continues to drop as the substance cools further. What might this suggest about energy transfer?
It suggests that energy is continuously lost as the temperature decreases until another phase change occurs.
Correct! This consistent energy transfer is essential for understanding heat exchange in calorimetry. Remember, 'Cold flows to warm,' which reinforces the direction of heat flow.
So, every time we see a slope, that’s when the temperature is decreasing?
Yes! Whenever the curve slopes down, the temperature is changing. A helpful tip: 'Slopes Show Cooling!' summarizes this idea effectively. Let's keep this in mind!
Applications of Cooling Curves
🔒 Unlock Audio Lesson
Sign up and enroll to listen to this audio lesson
Now that we understand cooling curves, can anyone think of a real-life example where cooling curves might apply?
I think it applies when cooking or baking something, like cooling a cake.
Exactly! When baked goods are taken out of the oven, they cool and may go through phase changes as moisture is lost. This is also true in metallurgy when cooling metals. Any other examples?
How about ice melting or freezing?
Great example! When ice melts, it initially absorbs heat without temperature change, reflected as a plateau on the cooling curve. Let's remember: 'Heat Takes Time!' during these phases.
So cooling curves really help us understand both everyday activities and industrial processes?
Yes! Understanding cooling curves helps in various fields, including food science and engineering, to optimize processes involving temperature changes.
This makes it clear why understanding these curves is so important!
Exactly! To summarize, cooling curves are not just graphs; they're powerful tools for understanding temperature-related processes in our everyday lives and industries.
Introduction & Overview
Read summaries of the section's main ideas at different levels of detail.
Quick Overview
Standard
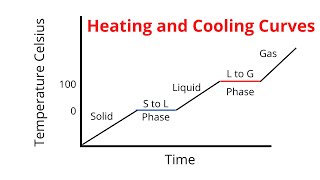
The cooling curve showcases how the temperature of a cooling substance varies with time. This includes constant temperature plateaus during phase changes when the substance transitions from one state to another and sloped sections indicating temperature changes, providing valuable insights into thermal processes.
Detailed
Cooling Curve
A cooling curve is a graphical representation illustrating how the temperature of a substance changes over time as it loses heat. This concept is fundamental in thermodynamics and calorimetry, as it visually captures two important aspects:
- Plateaus During Phase Changes: As a substance cools and undergoes changes in state (e.g., melting or boiling), there are regions on the curve where the temperature remains constant despite heat loss. These plateaus signify the heat energy being utilized in changing the state of the substance rather than changing its temperature.
- Sloped Portions During Temperature Changes: Between these flat regions, the curve displays slopes that represent temperature changes. During these intervals, the substance is cooling, namely when it is entirely in one state (solid, liquid, or gas), and its temperature decreases continuously.
Understanding these features is critical for applications in thermodynamics, chemical engineering, and environmental science, where managing temperature changes is essential.
Youtube Videos


Audio Book
Dive deep into the subject with an immersive audiobook experience.
Definition of a Cooling Curve
Chapter 1 of 3
🔒 Unlock Audio Chapter
Sign up and enroll to access the full audio experience
Chapter Content
● A cooling curve is a graph showing the variation of temperature with time as a substance cools.
Detailed Explanation
A cooling curve is a visual representation that tracks how the temperature of a substance changes over time as it cools down. When a hot substance is placed in a cooler environment, it loses heat, causing its temperature to drop. This graph plots time on the x-axis and temperature on the y-axis, allowing us to see the cooling process and understand how quickly or slowly temperature changes.
Examples & Analogies
Think of a cup of hot coffee left on the table. At first, the temperature is very high, but as time goes on, it cools down. If you were to plot its temperature against time, you would create a cooling curve that shows how the coffee gets cooler until it reaches room temperature.
Plateaus During Phase Changes
Chapter 2 of 3
🔒 Unlock Audio Chapter
Sign up and enroll to access the full audio experience
Chapter Content
● Shows: ○ Plateaus during phase changes (temperature remains constant)
Detailed Explanation
In a cooling curve, certain sections will appear as flat lines, known as plateaus. These plateaus occur during phase changes when the substance transitions from one state of matter to another, such as from liquid to solid. During this time, even though heat is still being removed from the substance, the temperature does not drop. Instead, the energy goes into changing the state while maintaining a constant temperature until the entire substance has completed the phase change.
Examples & Analogies
Imagine making ice at home. When you put water in the freezer, it cools down until it reaches 0 degrees Celsius. At this point, instead of the temperature dropping further, it remains at 0 degrees as ice forms. Only after all the water has turned into ice does the temperature continue to decrease.
Sloped Portions During Temperature Changes
Chapter 3 of 3
🔒 Unlock Audio Chapter
Sign up and enroll to access the full audio experience
Chapter Content
○ Sloped portions during temperature changes
Detailed Explanation
The sloped sections of a cooling curve indicate periods where the temperature of the substance is changing. These slopes reflect how the temperature decreases as heat is lost to the surroundings. The steepness of these slopes can provide information about the cooling rate; a steeper slope indicates a faster cooling process, while a gentler slope suggests a slower cooling period.
Examples & Analogies
Returning to the cup of hot coffee, after reaching the plateau (when it starts to solidify), if you check the temperature every minute, you would notice that initially, the temperature drops rapidly. This is like a steep slope on your cooling curve graph. As the coffee approaches room temperature, the temperature drop starts to slow down, creating a gentler slope.
Key Concepts
-
Cooling Curve: Graphically represents temperature changing over time as a substance cools.
-
Phase Changes: Regions on the graph where the temperature remains constant during a state transition.
-
Slopes: Indicate periods of cooling where the temperature decreases.
Examples & Applications
An ice cube cooling down to water temperature shows a cooling curve with plateaus during melting.
A metal rod cooling from a higher temperature to room temperature demonstrates sloped cooling before phase changes.
Memory Aids
Interactive tools to help you remember key concepts
Rhymes
When the temperature’s flat, state’s changing; cooling fades, it's rearranging!
Stories
Imagine a king's ice sculpture placed in the sun; it melts slowly, changing states while the temperature stays the same until it's all gone.
Memory Tools
Remember 'Plateaus Pause,' so with phase changes, temperature doesn't cause.
Acronyms
CUPS (Cooling-Understanding-Plateaus-Temperature-Slopes) to remember the cooling curve concepts!
Flash Cards
Glossary
- Cooling Curve
A graph showing the variation of temperature with time as a substance cools.
- Plateau
A flat section on a cooling curve indicating a phase change where temperature remains constant.
- Phase Change
The transition of a substance from one state of matter to another, such as solid to liquid.
- Slope
The slanted section of a cooling curve showing that the temperature of the substance is changing.
Reference links
Supplementary resources to enhance your learning experience.