
Trip Distribution
Enroll to start learning
You’ve not yet enrolled in this course. Please enroll for free to listen to audio lessons, classroom podcasts and take practice test.
Interactive Audio Lesson
Listen to a student-teacher conversation explaining the topic in a relatable way.
Introduction to Trip Distribution
🔒 Unlock Audio Lesson
Sign up and enroll to listen to this audio lesson

Welcome everyone! Today, we're diving into trip distribution, a crucial element of transportation planning. Can anyone tell me what they understand by trip distribution?

Isn't it about how we spread out trips from different places to various destinations?
Exactly! Trip distribution takes the trips generated in one zone and allocates them to other zones based on destination preferences. Now, how do we represent these trips mathematically?

Is it through something called a trip matrix?
Yes! A trip matrix is a two-dimensional array. Each cell shows trips from origin i to destination j. Remember, O signifies trips produced, while D signifies trips attracted. Together, they form a comprehensive view of travel patterns.

So, the sum of O across rows equals total trips coming from a zone, and D from columns equals trips coming to a zone, right?
Correct! That's vital to maintain. Let’s recap: Trip matrices help visualize trips across zones!
Generalized Cost in Trip Distribution
🔒 Unlock Audio Lesson
Sign up and enroll to listen to this audio lesson

Moving on, what factors might influence trip distribution? Any ideas?

I think costs like travel time or money would matter.
Absolutely! This idea is captured in the concept of generalized cost, which combines various cost elements into a single metric. Can anyone name a few components included in this cost?
In-vehicle travel time, waiting time, and fare!
Yes! Excellent memory! These factors together help determine the disincentives to travel - if costs rise, people might choose closer destinations.
So a higher generalized cost means fewer trips, and vice versa!
Exactly! This concept is pivotal in understanding travel behavior. Let's remember this as we explore further!
Methods of Trip Distribution
🔒 Unlock Audio Lesson
Sign up and enroll to listen to this audio lesson
Now, let’s discuss the methods for trip distribution. What’s the first method we covered?
The growth factor method! It adjusts trip estimates based on a growth factor, right?
Right! The uniform growth factor assumes a constant increase across all cells. But what happens when we have different growth rates?
That’s when we use the doubly constrained growth factor model?
Exactly! It accounts for growth in both production and attraction. Can someone explain how this model is solved?
You set up balancing factors and adjust until the totals match the constraints!
Great! Now, how does the gravity model differ from these methods?
It relates trip attraction to the size of zones and distance!
Exactly! This model requires calibration and balances to ensure accurate predictions. Fantastic job!
Advantages and Limitations of Models
🔒 Unlock Audio Lesson
Sign up and enroll to listen to this audio lesson
Now that we know the different trip distribution methods, what are some advantages of the growth factor model?
It's simple and quick for short-term predictions!
Correct! However, what might be some limitations?
It relies on historical data, and it doesn't adapt well to unobserved trips.
Good points! And what about the gravity model? What could be a downside?
It might require complex computations and calibration.
Exactly! Both models have their place in planning; understanding their strengths and weaknesses helps us choose the right tool for our needs.
Summarizing Key Concepts
🔒 Unlock Audio Lesson
Sign up and enroll to listen to this audio lesson
As we wrap up, can anyone summarize what trip distribution entails?
It’s about allocating generated trips to different zones based on various models!
Great! And what are the key methods we discussed?
The growth factor method and the gravity model.
Right! And remember, the trip matrix is vital in visualizing these distributions. Don’t forget the impact of generalized costs on travel choices! Any final questions?
Just to clarify, how do different models affect long-term planning?
Excellent question! The choice of model can greatly impact infrastructure development and resource allocation. Tailoring to specific conditions ensures better outcomes. Great discussion today, everyone!
Introduction & Overview
Read summaries of the section's main ideas at different levels of detail.
Quick Overview
Standard
The trip distribution phase in transportation modeling involves distributing trips from various origins to destinations using models such as the growth factor method and the gravity model. Understanding the trip matrix concepts and the impact of generalized costs plays a critical role in accurately predicting travel patterns and planning infrastructure.
Detailed
Trip Distribution
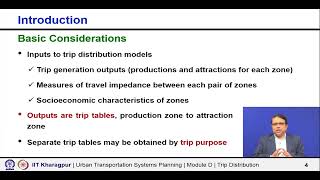
Trip distribution forms the second stage of travel demand modeling, succeeding the trip generation phase where the decision to travel is made. The main objective of trip distribution is to allocate the generated trips from each zone to all other zones according to their destination choices. Various methods can be employed for this purpose, with two prominent ones being the growth factor model and the gravity model.
Trip Matrix
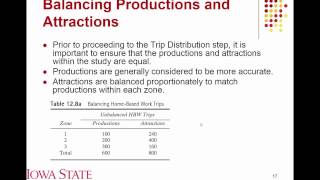
A trip matrix represents the patterns of trips in a study area through a two-dimensional array that delineates origins and destinations. Each cell within the matrix signifies the number of trips from one origin zone (i) to a destination zone (j). The total trips originating from each zone are denoted by O, while trips attracted to each zone are marked as D. These matrices can be constrained to ensure that the total outgoing and incoming trips are balanced.
Generalized Cost
The generalized cost of travel impacts trip distribution, considering elements like time, distance, and monetary costs. It is a composite metric that expresses the disutility of travel, which can significantly influence destination choices.
Growth Factor Methods
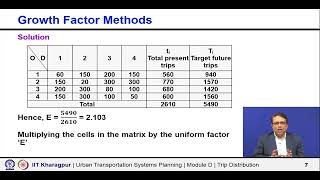
- Uniform Growth Factor: This method assumes a constant growth rate across all zones, making it simple yet limited, as it doesn't account for varying growth across different areas.
- Doubly Constrained Growth Factor Model: This model accounts for distinct growth rates in both productions and attractions across zones, allowing for a more nuanced distribution process.
Gravity Model
The gravity model draws an analogy to gravitational forces in physics, suggesting that trip attraction between two zones is proportional to their production and inversely proportional to the generalized cost of travel. This model requires careful calibration and can also be implemented in both singly and doubly constrained forms. Each application aids in evaluating travel patterns comprehensively.
By understanding trip distribution methods, planners can design efficient transportation systems that cater to community needs while minimizing congestion and enhancing accessibility.
Youtube Videos


Audio Book
Dive deep into the subject with an immersive audiobook experience.
Overview of Trip Distribution
Chapter 1 of 5
🔒 Unlock Audio Chapter
Sign up and enroll to access the full audio experience
Chapter Content
The decision to travel for a given purpose is called trip generation. These generated trips from each zone are then distributed to all other zones based on the choice of destination. This is called trip distribution, which forms the second stage of travel demand modeling. There are a number of methods to distribute trips among destinations; and two such methods are growth factor model and gravity model.
Detailed Explanation
Trip distribution is the process of allocating trips generated in one area (or zone) to other areas based on certain criteria, primarily the attractiveness of the destination. The overall trip generation occurs first, determining how many trips are produced in each zone. Once this is known, the next step is to distribute these trips effectively using various models, including the growth factor model and the gravity model. These models consider how trips are likely influenced by factors such as distance, population, and destination appeal, forming an essential aspect of transportation planning.
Examples & Analogies
Consider a school scenario where students (trips) are distributed among different classrooms (zones) based on their interest in subjects (destination attractiveness). Just as a student may choose their favorite subject-based classroom over others, trips are allocated to the most appealing destinations.
Methods of Trip Distribution
Chapter 2 of 5
🔒 Unlock Audio Chapter
Sign up and enroll to access the full audio experience
Chapter Content
There are a number of methods to distribute trips among destinations; and two such methods are growth factor model and gravity model. Growth factor model is a method which responds only to relative growth rates at origins and destinations, and this is suitable for short-term trend extrapolation. In gravity model, we start from assumptions about trip making behavior and the way it is influenced by external factors.
Detailed Explanation
The growth factor model uses previous trip data to project future trips based solely on a uniform growth rate. This method is simple and ideal for short-term planning as it directly bases future estimates on existing patterns. Meanwhile, the gravity model considers a more complex set of relationships, focusing on the interaction between origins and destinations. It operates under the assumption that locations generate trips based on their 'gravity,' or attractiveness, and is affected by various external factors such as roads and costs.
Examples & Analogies
You can think of the growth factor model like predicting how much popcorn you'll have based on your past consumption—if you had five bags of popcorn last year, you may estimate six for this year because of a small growth trend. In contrast, the gravity model is akin to contemplating why some movie theatres attract bigger crowds than others; perhaps they have better films, convenient locations, or lower ticket prices.
Calibration of Models
Chapter 3 of 5
🔒 Unlock Audio Chapter
Sign up and enroll to access the full audio experience
Chapter Content
An important aspect of the use of gravity models is their calibration, that is, the task of fixing their parameters so that the base year travel pattern is well represented by the model.
Detailed Explanation
Calibration is crucial for ensuring that the gravity model accurately reflects real-world travel patterns. This involves adjusting the model's parameters so that the travel forecasts align closely with observed data from a base year. The better the model's predictions match actual behavior, the more reliable it will be for future planning.
Examples & Analogies
Imagine a chef adjusting a recipe; if the cake doesn't rise as expected (like a model not matching reality), the chef will tweak the ingredients (model parameters) until it turns out just right. Similarly, calibration fine-tunes the model to perfectly predict trip distributions.
Trip Matrix Definition
Chapter 4 of 5
🔒 Unlock Audio Chapter
Sign up and enroll to access the full audio experience
Chapter Content
The trip pattern in a study area can be represented by means of a trip matrix or origin-destination (O-D) matrix. This is a two-dimensional array of cells where rows and columns represent each of the zones in the study area. The cells of each row i contain the trips originating in that zone which have destinations in the corresponding columns.
Detailed Explanation
A trip matrix provides a clear visual representation of trips between different zones. Each cell in the matrix shows the number of trips from one specific zone to another, allowing planners to quickly assess travel dynamics across the study area. The rows illustrate the origin zones while the columns represent the destination zones, making it easy to see where most trips are generated and where they are heading.
Examples & Analogies
Think of the trip matrix like a cafeteria menu where each row lists different meals (zones), and each column indicates different side dishes (destinations). The cells show how many of each meal comes with each side, helping cafeteria planners decide how much food to prepare.
Generalized Cost in Trip Distribution
Chapter 5 of 5
🔒 Unlock Audio Chapter
Sign up and enroll to access the full audio experience
Chapter Content
One of the factors that influences trip distribution is the relative travel cost between two zones. This cost element may be considered in terms of distance, time or money units. It is often convenient to use a measure combining all the main attributes related to the disutility of a journey and this is normally referred to as the generalized cost of travel.
Detailed Explanation
Generalized cost refers to a multifaceted calculation that represents the 'costs' associated with traveling between zones. It includes factors like travel time, fare costs, and other inconveniences like parking fees. This holistic view helps in understanding how these costs affect travel behavior, as higher costs generally discourage trips, while lower costs can encourage travel.
Examples & Analogies
Picture planning a trip: you consider gas prices (money), the time it takes to get there (time), and even how far away the parking lot is (inconvenience). If all roads lead to a concert but one way costs a lot more and is a hassle, you're likely to choose a different route, similar to how trip distribution considers these factors in allocating travel.
Key Concepts
-
Trip Generation: The process that initiates trip creation based on demographic and socioeconomic factors.
-
Trip Distribution: The allocation of generated trips from origin zones to destination zones.
-
Trip Matrix: A representation of trips in a two-dimensional form indicating origins and destinations.
-
Growth Factor Model: A straightforward method assuming constant growth rates in trip distribution.
-
Gravity Model: An advanced model using attraction based on distance and zone characteristics.
Examples & Applications
An example of a trip matrix would be one that shows trips from three different zones, each with different origins and destinations, reflecting their respective trip values.
An illustration of the gravity model in practice could involve evaluating the travel patterns of commuters in a metropolitan area based on different origin-destination pairings.
Memory Aids
Interactive tools to help you remember key concepts
Rhymes
When you trip and you roam, know where you’ll come home.
Stories
Imagine a bustling city where people live in zones. Each person must decide where to go, based on how far the destinations are and how much it will cost them.
Memory Tools
G.A.T.E. - Growth factor, Attraction, Trip matrix, and Equal distribution.
Acronyms
T.R.I.P. - Trip distribution, Relative costs, Influencing factors, Planning needs.
Flash Cards
Glossary
- Trip Generation
The initial phase in travel demand modeling that determines the number of trips originating from a zone.
- Trip Distribution
The process of allocating trips generated in origin zones to destination zones.
- Trip Matrix
A two-dimensional array representing trips between origin and destination zones.
- Growth Factor Model
A method for distributing trips based on a uniform growth rate assumption across zones.
- Gravity Model
A method of trip distribution that uses the analogy of gravitational forces to determine the allocation of trips based on zone sizes and distance.
- Generalized Cost
A composite measure that incorporates all costs associated with travel to evaluate trip attractiveness.
Reference links
Supplementary resources to enhance your learning experience.