
Example 1: Calculation of simple aggregative price index
Enroll to start learning
You’ve not yet enrolled in this course. Please enroll for free to listen to audio lessons, classroom podcasts and take practice test.
Interactive Audio Lesson
Listen to a student-teacher conversation explaining the topic in a relatable way.
Introduction to Index Numbers
🔒 Unlock Audio Lesson
Sign up and enroll to listen to this audio lesson

Let's explore what an index number is. An index number is essentially a tool that helps us measure the changes in a particular measure over time. Why do you think we need such tools in economics?

Maybe to understand how prices change?

And to see how our living standards improve or decline!
Exactly! Index numbers give us the ability to summarize diverse changes in price levels or quantities. So, can someone remember the formula for a simple aggregative price index?

Isn't it P1 equals the sum of current prices divided by the sum of base prices multiplied by 100?
Good job! That's the formula. So, if we found P1 equals 138.5, what does that signify?

It means there was a 38.5% increase in prices!
Correct! This simple way of understanding helps us visualize economic changes.
Calculating the Simple Aggregative Price Index
🔒 Unlock Audio Lesson
Sign up and enroll to listen to this audio lesson

Now let\u2019s apply the formula. Consider we have four commodities, and their prices in the base and current periods are as follows. Can anyone tell me how to set it up?
We'd list the base prices and current prices, then apply the formula?
And add the prices for each commodity separately.
Exactly! Let's calculate together. If the prices are 2, 5, 4, and 2 in the base period, and 4, 6, 5, and 3 in the current period, what do we get?
We sum those separately to get 4+6+5+3 for the current period and 2+5+4+2 for the base period.
Perfect! Now, what is 138.5 indicating?
That prices have increased by 38.5%!
Wonderful! Remember, this is a simplified approach, and we must caution ourselves about the limitations.
Limitations of the Simple Aggregative Price Index
🔒 Unlock Audio Lesson
Sign up and enroll to listen to this audio lesson
What do you think could be a drawback of using a simple aggregative price index?
It doesn\u2019t consider the importance of each item, right? Like food versus luxury goods!
Yes! Not every item affects the budget the same.
Exactly! This means if some items have larger shares in our expenses, we should consider that in our calculations. This leads to the need for weighted indices.
What\u2019s a weighted index exactly?
A weighted index factors in how important each item is by assigning different weights. Can someone explain why this is significant?
Because it better reflects economic realities, especially for essential goods!
Well done! Always remember, the context of data is crucial for interpreting economic analysis.
Introduction & Overview
Read summaries of the section's main ideas at different levels of detail.
Quick Overview
Standard
The section explains index numbers as a statistical tool for measuring changes in variables over time. It covers the calculation of simple aggregative price indices, clarifying the formula and providing practical examples. Additionally, it addresses the limitations of this method, emphasizing the importance of considering weights based on the significance of different commodities in real-world scenarios.
Detailed
Calculation of Simple Aggregative Price Index\n\nThis section focuses on the concept of index numbers, specifically how they can measure changes in various economic variables over time. An index number is a statistical device that expresses relative changes in several items grouped together, aiding in summarizing complex information. In particular, a simple aggregative price index allows for tracking price changes over different periods.\n\n#### Key Concepts:\n- Definition of Index Number: An index number measures the change in the value of a set of variables. It captures the average change in prices or quantities, allowing for temporal comparisons.\n- Simple Aggregative Price Index: The formula to calculate this index is given by: \n \n \n \n P_1 = \frac{\u03a3P_1}{\u03a3P_0} \u00d7 100 \n\n \n Where P_1 and P_0 are the current and base period prices, respectively. For instance, if a price index calculation yields 138.5, it indicates an increase of 38.5% in the price level from the base period.\n- Limitations: The simplistic nature of this method lacks the consideration of the varying significance (weights) of different commodities; thus, items with larger shares in consumer expenditure must be emphasized to reflect an accurate picture.\n\nIn the section, various examples illustrate the calculation process, and concepts such as the difference between weighted and unweighted indices are elaborated, stressing how weighted indices can provide a more nuanced understanding of economic realities. The section concludes by hinting at more complex methods that account for significant variables in index number calculations.
Youtube Videos


Audio Book
Dive deep into the subject with an immersive audiobook experience.
Understanding the Simple Aggregative Price Index
Chapter 1 of 4
🔒 Unlock Audio Chapter
Sign up and enroll to access the full audio experience
Chapter Content
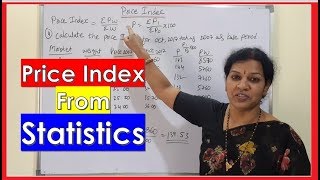
In the following sections, the principles of constructing an index number will be illustrated through price index numbers. The formula for a simple aggregative price index is:
P = ΣP₁ × 100 / ΣP₀,
where P₁ and P₀ indicate the price of the commodity in the current period and base period respectively.
Detailed Explanation
The simple aggregative price index is a way of measuring how prices change over time for a set of items. This formula essentially compares the current prices of these items to their prices in a base period, allowing us to see overall price changes. If we were to take a basket of goods and look at how their prices have increased or decreased, this formula tells us the average change expressed as a percentage.
Examples & Analogies
Imagine you went to the grocery store today and noted the prices of some items. If you compare these prices to the prices five years ago, you will get a sense of how much prices have risen. For instance, if a loaf of bread cost $1 five years ago and now costs $1.50, using our formula helps us calculate the overall price increase for all items in your cart.
Example Calculation of Price Index
Chapter 2 of 4
🔒 Unlock Audio Chapter
Sign up and enroll to access the full audio experience
Chapter Content
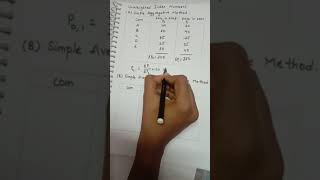
Using data from example 1, the simple aggregative price index is calculated as follows:
P = (4+6+5+3) / (2+5+4+2) × 100 = 138.5.
Here, price is said to have risen by 38.5 percent.
Detailed Explanation
In this example, we sum the current prices of four commodities (4+6+5+3) which gives us 18. Then, we sum the base period prices for the same commodities (2+5+4+2) which gives us 13. We then divide the sum of the current prices by the sum of the base prices and multiply by 100 to convert it to a percentage. The result, 138.5, tells us that there has been an overall price increase of 38.5%.
Examples & Analogies
Think of it like measuring your growth over the years by comparing your height at different ages. Just as you’d compare your current height to what it was when you were younger, we compare current prices to past prices to see how much they’ve changed. If you grew from 4 feet to 5.5 feet, that’s a noticeable increase, just like our price index shows a significant rise.
Limitations of the Simple Index
Chapter 3 of 4
🔒 Unlock Audio Chapter
Sign up and enroll to access the full audio experience
Chapter Content
Do you know that such an index is of limited use? The reason is that the units of measurement of prices of various commodities are not the same. It is unweighted, because the relative importance of the items has not been properly reflected.
Detailed Explanation
The limitation of the simple aggregative price index is that it treats all commodities as equal, without considering how much of our budget is spent on each item. For instance, if you spend most of your money on food, a rise in food prices will affect you more than a rise in the price of jewelry, even if both items have the same percentage increase. This makes the index less accurate in reflecting the real cost of living.
Examples & Analogies
Imagine if you were tracking the overall price of a meal at a restaurant but included drinks, appetizers, and desserts equally, regardless of how much you typically spend on each. If the dessert price goes up significantly but you hardly ever buy desserts, that inflation won’t impact you like the price of your main dish that you buy regularly. This example shows how unequal weighting can misrepresent your true spending experience.
Moving to a Weighted Price Index
Chapter 4 of 4
🔒 Unlock Audio Chapter
Sign up and enroll to access the full audio experience
Chapter Content
There are two methods of constructing an index number: It can be computed by the aggregative method and by the method of averaging relatives.
An index number becomes a weighted index when the relative importance of items is taken care of.
Detailed Explanation
Weighted index numbers account for the different levels of importance of various items. This means that instead of treating all items equally, we consider how much they contribute to overall spending. For instance, if food makes up a large part of a household's expenses, it should carry more weight in the index than a luxury item that is rarely purchased.
Examples & Analogies
Think about how you allocate your allowance. If you spend 60% of it on food, 20% on clothing, and the rest on entertainment, a change in food prices should be more impactful in your calculations of how much your costs have risen compared to clothing or entertainment. Thus, a weighted index provides a clearer picture of the economic reality.
Examples & Applications
Example of calculating a simple aggregative price index with commodities A, B, C, and D.
Illustration of the significance of a weighted index versus a simple index in understanding real economic conditions.
Memory Aids
Interactive tools to help you remember key concepts
Rhymes
Index shows the price in flow, increases or decreases, you\u2019ll know.
Stories
Imagine a shopper over time, buying bread at varied prices; they track prices with an index to ensure they are doing fine.
Memory Tools
PIVOT: Price Index Values Over Time
Acronyms
AIP
Aggregative Index Prices
Flash Cards
Glossary
- Index Number
A statistical measure used to represent changes in a variable or group of variables over time.
- Simple Aggregative Price Index
An index that compares the current prices of a basket of commodities to their prices in a base period.
- Weighted Index
An index that accounts for the different importance of various items by assigning weights to each.
- Base Period
The time point or period against which future values are compared to determine changes.
- Price Index
An index that measures the change in the price level of a basket of goods over time.
Reference links
Supplementary resources to enhance your learning experience.