
Method of Averaging relatives
Enroll to start learning
You’ve not yet enrolled in this course. Please enroll for free to listen to audio lessons, classroom podcasts and take practice test.
Interactive Audio Lesson
Listen to a student-teacher conversation explaining the topic in a relatable way.
Introduction to Index Numbers
🔒 Unlock Audio Lesson
Sign up and enroll to listen to this audio lesson

Today, we will delve into index numbers, a powerful tool for measuring changes in prices and economic conditions. Can anyone tell me why index numbers are important?

They show how prices change over time!

Yes, and they help us understand inflation!
Correct! Index numbers allow us to summarize complex data into a single meaningful figure. Let’s look deeper into the method of averaging relatives.
Understanding Relative Prices
🔒 Unlock Audio Lesson
Sign up and enroll to listen to this audio lesson

Relative price is calculated by comparing the price of a commodity in the current period to its price in the base period. Can anyone give me an example?

If a loaf of bread costs Rs 20 today and Rs 10 in the base year, the relative price would be 200%.
Exactly! That's how we start to see the changes in price. These relatives can then be averaged to form an index number.

What about weighted averages? Why do we need them?
Great question! Weighted averages help account for the importance of each item, ensuring a more accurate reflection of price changes.
Calculating Weighted Indices
🔒 Unlock Audio Lesson
Sign up and enroll to listen to this audio lesson
Let’s discuss how we calculate a weighted index. When we create an index number, we use weights based on importance. Who can remind us of the two types of weighted averages?
Laspeyre’s index uses base period weights, and Paasche’s index uses current period weights, right?
Exactly! Each has its use, depending on what we’re analyzing. For accurate inflation measurements, it’s essential to use the right index method.
Understanding Limitations
🔒 Unlock Audio Lesson
Sign up and enroll to listen to this audio lesson
Choosing the wrong base year or excluding important items can distort the index!
Yeah, so we must be careful with data collection!
Absolutely! Reliable data sources lead to meaningful insights. Remember, a well-constructed index number becomes a vital economic tool.
Conclusion and Application
🔒 Unlock Audio Lesson
Sign up and enroll to listen to this audio lesson
To conclude, index numbers help us track economic health and inform policy decisions. Can anyone think of real-world examples where indices are used?
The stock market! Sensex is an index, right?
And CPI helps gauge living costs!
Very well done! Remember, understanding these numbers helps us interpret economic conditions effectively.
Introduction & Overview
Read summaries of the section's main ideas at different levels of detail.
Quick Overview
Standard
The method of averaging relatives is crucial for creating index numbers that reflect price changes. It stresses the importance of accounting for weight in each item to obtain a weighted price index, ensuring a more accurate measure of inflation and price dynamics.
Detailed
Method of Averaging Relatives
The method of averaging relatives is an essential approach in the construction of index numbers. An index number serves as a statistical tool to measure price changes across a range of commodities over time. The method involves calculating the relative price changes of each item relative to a base period. This relative change is then averaged to create an overall price index.
Key Concepts:
- Relative Price: The relative price of a commodity is computed as the current price divided by the base price, expressed as a percentage.
- Weighted Index: Unlike simple averages, a weighted index considers the relative importance of each item, ensuring that the commodities that constitute a larger portion of overall expenditure have a greater impact on the index.
- Laspeyre’s and Paasche’s Index: These are two commonly used formulas for calculating weighted average indices using base period and current period quantities as weights, respectively. The selection of the method depends on the context of analysis.
Overall, utilizing the method of averaging relatives aids economists and researchers in accurately assessing changes in living costs, inflation, and economic trends.
Youtube Videos


Audio Book
Dive deep into the subject with an immersive audiobook experience.
Understanding Price Index and Price Relatives
Chapter 1 of 4
🔒 Unlock Audio Chapter
Sign up and enroll to access the full audio experience
Chapter Content
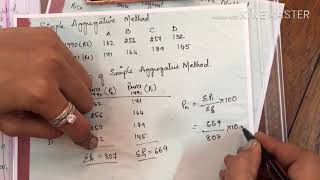
When there is only one commodity, the price index is the ratio of the price of the commodity in the current period to that in the base period, usually expressed in percentage terms. The method of averaging relatives takes the average of these relatives when there are many commodities.
Detailed Explanation
This chunk explains how the price index is calculated for a single commodity and when dealing with multiple commodities. For a single commodity, you find the price in the current period and the price in the base period. The price index is calculated as a percentage to express how much the price has changed compared to the base period. For multiple commodities, you average the price relatives instead of calculating each individually.
Examples & Analogies
Imagine you have a fruit stand. If apples cost $2 last year and now cost $3, the price index for apples is calculated as (3/2) * 100 = 150%. If you sell bananas and oranges too, and their prices have changed as well, instead of calculating each fruit's percentage change separately, you would average the changes to get a better overall view of how your fruit prices are varying over time.
The Formula for Price Index Calculation
Chapter 2 of 4
🔒 Unlock Audio Chapter
Sign up and enroll to access the full audio experience
Chapter Content
The price index number using price relatives is defined as P = Σ (P1i/P0i) × 100, where P1 is the price of the ith commodity in the current period and P0 is the price in the base period.
Detailed Explanation
This formula summarizes how to calculate the price index using price relatives. P1 and P0 represent the current and base prices of multiple commodities. By taking the ratio of each current price to its respective base price and multiplying by 100, you get a clearer view of the overall change in prices across all commodities. Summing these individual ratios gives a comprehensive index number.
Examples & Analogies
Think of a school where students' test scores are compared from one year to the next. If in one subject a student scored 80 last year and 90 this year, their relative performance has improved. You can use a similar method to calculate the overall performance of all students across various subjects by taking their scores, comparing them year-round, and summarizing it all in a single performance index.
Weighted Price Relatives
Chapter 3 of 4
🔒 Unlock Audio Chapter
Sign up and enroll to access the full audio experience
Chapter Content
The weighted price index is the weighted arithmetic mean of price relatives defined as ∑ (Wi × (P1i/P0i) × 100) / ∑ Wi, where W represents the weight assigned based on relative importance.
Detailed Explanation
This part of the chunk discusses how to give more significance to certain items that might weigh more in total consumer expenditure. In this formula, each commodity's price relative is multiplied by its weight (importance) and added together. This sum is then divided by the total weights to derive a more meaningful index that reflects the actual significance of price changes in daily life.
Examples & Analogies
Imagine a group of friends planning to buy groceries for a party. If one friend wants a lot of snacks (which might cost a lot), they should have a heavier influence on the total budget compared to another friend who just wants a few sodas. Therefore, prices for snacks would carry more 'weight' in the budget index than sodas, similar to calculating a weighted price index.
Importance of Weights
Chapter 4 of 4
🔒 Unlock Audio Chapter
Sign up and enroll to access the full audio experience
Chapter Content
In general, the base period weight is preferred to the current period weight because calculating the weight every year is inconvenient. It also refers to the changing values of different baskets. They are strictly not comparable.
Detailed Explanation
This chunk emphasizes the significance of using the base period's weights when calculating price indices. It suggests that it's more efficient and reliable to use the weightings from a consistent base period instead of recalculating them annually due to the potential difficulty and inconsistency it may introduce over time. By using a fixed basket of goods from the base period, the indices remain standardized and comparable over different time periods.
Examples & Analogies
Consider a marathon race where athletes are timed. If a new method of timing is introduced every year, comparing times from different years becomes complicated and unfair because the stopwatch types vary. Using a consistent timing method (base period weight) allows for fair comparisons of performance across years.
Key Concepts
-
Relative Price: The relative price of a commodity is computed as the current price divided by the base price, expressed as a percentage.
-
Weighted Index: Unlike simple averages, a weighted index considers the relative importance of each item, ensuring that the commodities that constitute a larger portion of overall expenditure have a greater impact on the index.
-
Laspeyre’s and Paasche’s Index: These are two commonly used formulas for calculating weighted average indices using base period and current period quantities as weights, respectively. The selection of the method depends on the context of analysis.
-
Overall, utilizing the method of averaging relatives aids economists and researchers in accurately assessing changes in living costs, inflation, and economic trends.
Examples & Applications
If a loaf of bread costs Rs 10 in 2000 and Rs 20 in 2020, the price relative is 200%.
Using base period weights from 1980, if the basket of goods cost Rs 100 in the base year and Rs 135.3 in the current year, the index shows a 35.3% increase.
Memory Aids
Interactive tools to help you remember key concepts
Rhymes
To find relative prices, just divide, then by hundred, let it glide.
Stories
Imagine going to buy groceries. You notice that apples have doubled in price while bananas have only gone up slightly. You realize you must consider how much of each you buy to truly understand the increase in your overall expenses.
Memory Tools
L - Laspeyre’s uses base, P - Paasche’s is current, easy to trace!
Acronyms
RPI - Relative Price Index - Let’s remember
Prices compared
how much it goes shared!
Flash Cards
Glossary
- Index Number
A statistical measure that represents changes in a group of related variables over time.
- Relative Price
The current price of a commodity expressed as a percentage of its base period price.
- Weighted Index
An index that considers the relative importance of items when calculating an average.
- Laspeyre’s Index
A weighted index that uses base period quantities as weights.
- Paasche’s Index
A weighted index that uses current period quantities as weights.
Reference links
Supplementary resources to enhance your learning experience.