
Exponential Smoothing Methods
Enroll to start learning
You’ve not yet enrolled in this course. Please enroll for free to listen to audio lessons, classroom podcasts and take practice test.
Interactive Audio Lesson
Listen to a student-teacher conversation explaining the topic in a relatable way.
Simple Exponential Smoothing
🔒 Unlock Audio Lesson
Sign up and enroll to listen to this audio lesson

Let's start with Simple Exponential Smoothing, or SES. It's primarily used for forecasting data without any trend or seasonality. Does anyone know how SES incorporates past observations?

Is it something about averaging past values?
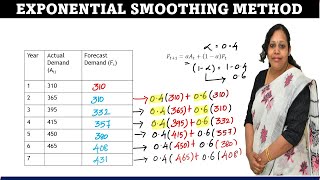
Exactly! SES uses a weighted average, where the formula is: **ŷt = αyt + (1-α)ŷt-1**. The alpha (α) value determines how much weight is applied to recent observations versus older ones. A higher alpha places more emphasis on recent data.

What happens if the data has a seasonality?
Great question! SES may not be suitable for seasonal data because it doesn't account for seasonal patterns.

How do we select the alpha value?
The alpha is usually selected by minimizing forecasting errors over a validation set. Let's recap: SES is useful for consistent, non-seasonal data, and alpha adjusts the smoothing weight.
Holt's Linear Trend Model
🔒 Unlock Audio Lesson
Sign up and enroll to listen to this audio lesson

Next, we have Holt’s Linear Trend Model. This method expands on SES by accounting for trends in the data. Can anyone explain the significance of recognizing trends?

Recognizing trends helps in understanding the long-term direction of the data, right?
"Correct! Holt’s model uses two equations: one for the level and one for the trend. This allows the forecast to adapt over time. The equations are:
Holt-Winters Model
🔒 Unlock Audio Lesson
Sign up and enroll to listen to this audio lesson
Finally, let’s explore the Holt-Winters Model which allows us to accommodate both trends and seasonality. Does anyone recall how we denote the seasonal component?
Is it using additive or multiplicative components?
Correct! We can use either depending on how the seasonal effect interacts with the level of the series. If you identify a consistent seasonality pattern, the additive model is often simpler. If seasonal variations compound with the level, the multiplicative is more suitable.
Does the formula change much from Holt’s model?
"It does! The model combines the previous levels and trends adapted to seasonal components through the equation:
Introduction & Overview
Read summaries of the section's main ideas at different levels of detail.
Quick Overview
Standard
This section covers various exponential smoothing techniques, including Simple Exponential Smoothing, Holt's Linear Trend Model, and Holt-Winters Model, each tailored for specific data characteristics such as trend and seasonality.
Detailed
Exponential Smoothing Methods
In time series forecasting, Exponential Smoothing methods are crucial for producing reliable predictions based on historical data. These methods allow for different adjustments based on the characteristics of the data:
- Simple Exponential Smoothing (SES) is effective for data without trend or seasonality and updates forecasts using a weighted average of past observations, where more recent data is emphasized.
- Holt’s Linear Trend Model incorporates data with a trend, providing separate equations for estimating the level and trend of the data series.
- Holt-Winters Model is useful for time series exhibiting both trend and seasonality, offering additive or multiplicative versions for flexibility in handling these varied patterns.
Each of these exponential smoothing methods builds upon the other, allowing forecasters to cater their approach based on observed data characteristics. This section emphasizes the importance of model selection in achieving accurate forecasts.
Youtube Videos

Audio Book
Dive deep into the subject with an immersive audiobook experience.
Simple Exponential Smoothing (SES)
Chapter 1 of 3
🔒 Unlock Audio Chapter
Sign up and enroll to access the full audio experience
Chapter Content
- Simple Exponential Smoothing (SES)
Used when the data has no trend or seasonality.
• 𝑦̂ = 𝛼𝑦 + (1−𝛼)𝑦̂
𝑡 𝑡−1 𝑡−1
Detailed Explanation
Simple Exponential Smoothing (SES) is a forecasting method used when we do not observe any trend or seasonal patterns in the data. SES works by taking a weighted average of past observations. In the formula, '𝑦̂' represents the forecast for the current time period, '𝛼' is the smoothing constant (a value between 0 and 1), '𝑦' is the actual observation from the current period, and '𝑦̂' is the forecasted value from the previous period. The weight given to the most recent observation is determined by '𝛼', while (1−𝛼) weights the previous forecast. A higher '𝛼' means more emphasis on recent observations, making the model more sensitive to recent changes.
Examples & Analogies
Consider a bookstore that has been selling a constant number of books monthly. With no significant changes in sales patterns, they can use SES to forecast next month’s sales. If the previous month’s sales were 100 books, the forecast can incorporate this figure along with the smoothing constant set to 0.7 (for instance). Therefore, the forecast for next month will lean more towards the actual sales number of 100 with less influence from older sales data.
Holt’s Linear Trend Model
Chapter 2 of 3
🔒 Unlock Audio Chapter
Sign up and enroll to access the full audio experience
Chapter Content
- Holt’s Linear Trend Model
Accounts for trend:
• Level and trend equations.
Detailed Explanation
Holt’s Linear Trend Model extends SES by considering data that exhibits a linear trend, which means there is a consistent increase or decrease over time. This model incorporates two components: the level (the baseline value) and the trend (the rate of increase or decrease). The method generates two equations: one for the level (similar to SES) and another for the trend. It uses the observations to update both components, making the forecasts more accurate when trends are present.
Examples & Analogies
Imagine a company's sales data is steadily increasing by 10% each month. By applying Holt’s model, the company not only acknowledges the current month's sales but also adjusts future predictions by accounting for the upward trend over the past months. This is like tracking a rising tide where each wave builds upon the previous one, making it crucial to expect further increases.
Holt-Winters Model
Chapter 3 of 3
🔒 Unlock Audio Chapter
Sign up and enroll to access the full audio experience
Chapter Content
- Holt-Winters Model
Handles both trend and seasonality.
• Additive and multiplicative versions available.
Detailed Explanation
The Holt-Winters Model is designed to address datasets that exhibit both trend and seasonal patterns. It enhances Holt's model by introducing a seasonal component, which can be additive or multiplicative. In the additive version, the seasonal effect is constant, while in the multiplicative version, the seasonal effect varies in proportion to the level of the series. This dual consideration allows the model to provide more accurate forecasts for situations where both trend and seasonal aspects are significant.
Examples & Analogies
Consider a company that sells ice cream. Their sales are higher in summer (seasonality) and also exhibit a growing trend as more customers discover their unique flavors. The Holt-Winters model can help them predict future sales accurately by accounting both for the seasonal increase each summer and the general growth in popularity over the years, allowing the business to prepare for inventory and staffing changes.
Key Concepts
-
Exponential Smoothing: A forecasting method that weights past observations to predict future values.
-
Simple Exponential Smoothing: Suitable for data lacking trend or seasonality.
-
Holt's Linear Trend Model: A method that extends SES to data with trends.
-
Holt-Winters Model: A forecasting approach that accounts for both trend and seasonality.
Examples & Applications
Example of SES could involve forecasting monthly sales for a stable product without significant seasonal variations.
An example of Holt's model would be forecasting monthly sales for a product showing a consistent upward trend.
A Holt-Winters example could involve predicting seasonal sales increases during holiday months while accounting for overall growth.
Memory Aids
Interactive tools to help you remember key concepts
Rhymes
For smoothing it's all in the weights, / SES first to manage the traits.
Stories
Imagine a farmer who measures crop yield each year; he notices his yields are increasing steadily and also see seasonal rains. To adjust for both, he uses Holt-Winters for accurate forecasts.
Memory Tools
Remember: S-H-W for smoothing methods: S for Simple, H for Holt's, and W for Holt-Winters.
Acronyms
The acronym SHT-W can help remember Simple, Holt, and Holt-Winters for trend patterns.
Flash Cards
Glossary
- Simple Exponential Smoothing (SES)
A forecasting technique that uses a weighted average of past observations, suitable for data without trend or seasonality.
- Holt’s Linear Trend Model
An extension of SES that accommodates data with trends using level and trend equations.
- HoltWinters Model
A forecasting model that incorporates both trend and seasonality, available in additive and multiplicative forms.
Reference links
Supplementary resources to enhance your learning experience.