
Temperature Profile as a Function of Height
Enroll to start learning
You’ve not yet enrolled in this course. Please enroll for free to listen to audio lessons, classroom podcasts and take practice test.
Interactive Audio Lesson
Listen to a student-teacher conversation explaining the topic in a relatable way.
Introduction to Temperature Profiles
🔒 Unlock Audio Lesson
Sign up and enroll to listen to this audio lesson

Today, we are discussing the temperature profile as a function of height. Can anyone tell me what a temperature profile is?

Is it how temperature changes from the ground up into the atmosphere?
Exactly! And this profile can greatly influence factors like air movement. Why do you think temperature differences affect air masses?

Because warmer air is less dense and tends to rise?
That's correct! This process is known as vertical convection, driven by thermal forces.
Daily Temperature Fluctuations
🔒 Unlock Audio Lesson
Sign up and enroll to listen to this audio lesson

As the day progresses, how does the ground temperature typically compare to the air temperature?

During the day, the ground heats up faster than the air above, right?
Absolutely! This creates a positive temperature gradient where the air near the surface is warmer. What happens when the sun sets?

The ground cools quickly, and the air stays warmer for a while.
Well observed! The difference in cooling rates can lead to fog formation as well at night.
Understanding the Environmental Lapse Rate
🔒 Unlock Audio Lesson
Sign up and enroll to listen to this audio lesson
What do we mean by environmental lapse rate?
It's the rate of temperature change with height in the atmosphere!
Correct! And it can vary throughout the day. Why is this knowledge important for environmental science?
It affects how pollutants disperse in the air.
Exactly! A stable lapse rate can trap pollutants near the ground.
Temperature Inversions and Pollutant Transport
🔒 Unlock Audio Lesson
Sign up and enroll to listen to this audio lesson
What happens during a temperature inversion?
The temperature increases with height instead of decreasing.
Exactly! And why is this important?
It can keep pollutants trapped near the surface.
Right! This is why understanding temperature profiles is crucial for predicting air quality.
Application of Lapse Rates to Pollution Modeling
🔒 Unlock Audio Lesson
Sign up and enroll to listen to this audio lesson
In pollution modeling, we often refer to the mixing height. Know what that is?
It's where the environmental lapse rate meets the adiabatic lapse rate?
Good! It helps determine how pollutants will disperse in the atmosphere.
Can we apply this to real situations?
Yes! Accurate predictions for pollutant concentrations downwind rely on mixing height and stability.
Introduction & Overview
Read summaries of the section's main ideas at different levels of detail.
Quick Overview
Standard
This section explores the concept of temperature profiles in the atmosphere, emphasizing the differences in temperature from the ground up to the troposphere. It explains how soil and air temperatures vary at different times of the day and their implications for air pollution, including the effect of environmental lapse rates and the phenomenon of temperature inversion.
Detailed
Temperature Profile as a Function of Height
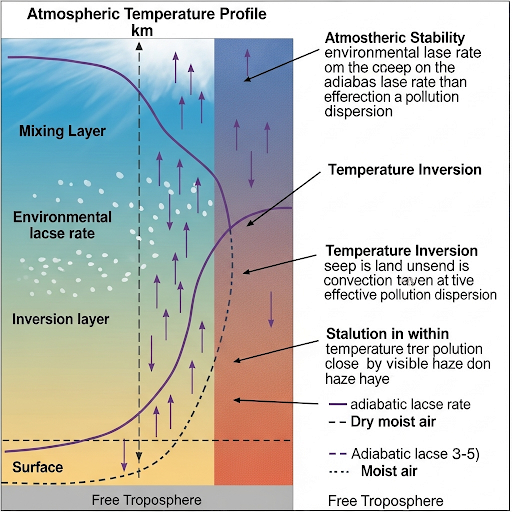
This section provides an overview of how temperature varies with height in the atmosphere, which is critical for understanding environmental quality and pollutant transport. The main concepts discussed include:
- Vertical Convection: Defined by a temperature difference that causes air movement. The temperature profile indicates how temperature typically decreases with height, particularly in the troposphere.
- Daily Temperature Fluctuations: The temperature profile varies throughout the day as solar radiation heats the land faster than the air. During peak daytime hours, the ground becomes hotter than the air above, leading to a positive temperature gradient. As the day progresses to evening, the soil cools rapidly, resulting in changing thermal gradients and the potential for phenomena such as fog formation.
- Environmental Lapse Rate: This term describes the rate at which temperature changes with height in a particular environment. The lapse rate varies with time of day and seasonal changes and is crucial for understanding atmospheric stability.
- Temperature Inversion: An important phenomenon where, instead of decreasing, temperature increases with height, which impacts the dispersion of pollutants significantly.
-
Lapse Rate Interactions: When pollutants are released, their movement is influenced by both the environmental lapse rate and the dry adiabatic lapse rate. The atmospheric conditions surrounding this release determine whether the pollutant will rise or sink based on the stability of the air.
This section highlights the practical implications for air quality and the dispersion of pollutants in the atmosphere, where variations in temperature profiles can have significant environmental and health impacts.
Youtube Videos


Audio Book
Dive deep into the subject with an immersive audiobook experience.
Understanding Temperature Profiles
Chapter 1 of 6
🔒 Unlock Audio Chapter
Sign up and enroll to access the full audio experience
Chapter Content
Okay, so, let’s consider two things, first thing to be considered is what is called as the temperature profile as a function of height. So, we are saying that vertical convection happens as a result of thermal forces which means there’s a temperature difference. So, what is the temperature difference that will result in vertical movement of air masses? So, which means that I need to know what is the temperature profile as a function of height.
Detailed Explanation
This chunk introduces the concept of a temperature profile with respect to height in the atmosphere. It explains that understanding this profile is essential because temperature differences in the atmosphere lead to vertical air movement (or convection). The key idea is that as the temperature varies with height, air masses will move vertically due to differences in their density, which is influenced by temperature.
Examples & Analogies
Imagine a campfire; as the fire heats the air above it, the warm air rises because it is lighter than the cooler air surrounding it. This is similar to how temperature profiles in the atmosphere cause air to move: warmer air rises while cooler air sinks.
Daytime Heating and Temperature Gradients
Chapter 2 of 6
🔒 Unlock Audio Chapter
Sign up and enroll to access the full audio experience
Chapter Content
During daytime the radiation heats up the soil or the land faster than it heats the air. So, the radiation directly heats the soil. ... So, you are expecting to see this kind of a gradient in the temperature.
Detailed Explanation
This section focuses on how solar radiation heats the ground more quickly than the air. As the ground heats up, it transfers heat to the air above, creating a vertical temperature gradient where the air closest to the ground is warmer. This gradient leads to more air movement as warmer, lighter air rises and cooler, denser air sinks.
Examples & Analogies
Think of a hot asphalt road on a sunny day. The pavement gets much warmer than the air above it. If you've ever noticed that the air above the pavement seems to shimmer, that's the warm air rising, creating a visible effect of heat rising into the cooler air above.
Cooling at Night and Temperature Changes
Chapter 3 of 6
🔒 Unlock Audio Chapter
Sign up and enroll to access the full audio experience
Chapter Content
Then you see a certain small decrease, the air is still hot but the soil has started cooling so, you start seeing this kind of behavior.
Detailed Explanation
At night, the ground cools more quickly than the air, which can result in a reversal of the earlier temperature gradient. As the soil loses its heat, the warmer air above it still persists for a while. This behavior demonstrates that temperature gradients are dynamic and change throughout the day.
Examples & Analogies
Think about a warm day turning into a cool night. The grass and soil cool down quickly as the sun sets, but the air above remains warm for a time. If you've ever felt a chill outside shortly after sunset while the air was still warm, you've experienced this phenomenon.
Temperature Inversion Explained
Chapter 4 of 6
🔒 Unlock Audio Chapter
Sign up and enroll to access the full audio experience
Chapter Content
So this profile is called as an environmental lapse rate. It is called a lapse rate because it is temperature profile as a function of height.
Detailed Explanation
The temperature profile that has been described is referred to as the environmental lapse rate. This term signifies how temperature typically decreases with height; however, if the temperature increases with height, it indicates a temperature inversion. This is significant for understanding air quality and pollution dispersion since pollutants can become trapped in the cooler air below the inversion layer.
Examples & Analogies
Imagine a multilayered cake, where the top layers are cooler than the bottom layers. If pollution is released at the bottom layer (the cool layer) and there’s a warmer layer above, those pollutants might get trapped under the warm layer, similar to how your cake layers might stack up, preventing the bottom from rising to the top.
Effect of Environmental Lapse Rate on Pollutant Transport
Chapter 5 of 6
🔒 Unlock Audio Chapter
Sign up and enroll to access the full audio experience
Chapter Content
In the system if I drop a parcel of air coming from a pollutant source ... depending on what is the condition in the environmental lapse rate.
Detailed Explanation
When pollutants are released from a source, their movement is influenced by the environmental lapse rate. If the released air is warmer than the surrounding air, buoyancy will cause it to rise. However, as it rises, it also cools and expands, which is described by the dry adiabatic lapse rate. Understanding these interactions helps predict how pollutants will disperse in the atmosphere.
Examples & Analogies
Think about smoke rising from a chimney. If the smoke is warmer than the ambient air, it will rise. However, as it goes higher and encounters cooler air, it might start to cool and spread out. This is how pollutants can behave in the atmosphere, influenced by temperature differences and buoyancy.
Stability and Mixing Heights in the Atmosphere
Chapter 6 of 6
🔒 Unlock Audio Chapter
Sign up and enroll to access the full audio experience
Chapter Content
Environmental lapse rate is known at different times of the day ... based on the pollution profile in that region.
Detailed Explanation
The concept of stability relates to how air parcels behave when disturbed. If a parcel is warmer than its surroundings, it will rise; if cooler, it will sink. This leads to different stability conditions: stable, unstable, and neutral. The mixing height is crucial for predicting pollution dispersion as it determines how far pollutants can spread vertically.
Examples & Analogies
Imagine a party balloon filled with helium. If you release it, it quickly shoots up because it's lighter (or less dense) than the surrounding air. But if you had a heavier balloon, it would sink. The interaction of these forces — buoyancy versus density — affects how pollutants spread in the atmosphere, similar to how balloons behave differently when released.
Key Concepts
-
Temperature Profile: Variation of temperature with height influences weather and pollutant dispersion.
-
Environmental Lapse Rate: Rate of temperature change with altitude, affecting stability and pollutant behavior.
-
Temperature Inversion: A reversal where temperature increases with height, trapping pollutants close to the ground.
Examples & Applications
During the afternoon, the air temperature may be 30°C, while the ground can be much hotter at 45°C.
In winter, temperature inversions can lead to fog formation at night, which dissipates quickly with morning sunlight.
Memory Aids
Interactive tools to help you remember key concepts
Rhymes
As you rise up in height, air gets cool, it's a thermal fight!
Stories
Imagine a balloon filled with warm air drifting upwards; as it rises, it cools down as it meets less pressure, just like how our atmosphere works!
Memory Tools
Remember LAPSE: L for Lapse rate, A for Adiabatic, P for Pollutants, S for Surface, E for Environment.
Acronyms
CAP
Convection
Adiabatic cooling
Pollutant dispersion.
Flash Cards
Glossary
- Temperature Profile
The variation of temperature with height in the atmosphere.
- Vertical Convection
The movement of air masses due to temperature differences.
- Environmental Lapse Rate
The rate at which temperature decreases with rising altitude in the atmosphere.
- Temperature Inversion
A situation where temperature increases with height instead of the normal decrease.
- Adiabatic Lapse Rate
The rate at which the temperature of an air parcel changes as it rises in the atmosphere without heat exchange.
- Mixing Height
The height at which the environmental lapse rate and the adiabatic lapse rate intersect.
Reference links
Supplementary resources to enhance your learning experience.