
Dispersion Model Parameters - Part 2
Enroll to start learning
You’ve not yet enrolled in this course. Please enroll for free to listen to audio lessons, classroom podcasts and take practice test.
Interactive Audio Lesson
Listen to a student-teacher conversation explaining the topic in a relatable way.
Understanding Wind Speed at Stack Height
🔒 Unlock Audio Lesson
Sign up and enroll to listen to this audio lesson

Let's start with the first parameter in our dispersion model: wind speed, specifically at the stack height. Can anyone tell me why we focus on this height for measuring wind speed?

Because the stack height is where the emissions are released, right?
Exactly! The wind speed at this height influences how quickly pollutants disperse. Now, does anyone know how we typically measure or estimate this wind speed?

Isn’t it through an anemometer located at a nearby weather station?
Yes! But remember, we often need to adjust that measurement because wind speed changes with height. There’s a velocity gradient caused by friction with the ground. Can anyone explain this gradient concept?

The speed decreases as you get closer to the ground due to the surface friction, and it’s higher at greater heights!
Great! This leads us to understanding how to estimate wind speed using equations that represent this gradient, like logarithmic or power law relationships. Summary: Wind speed at stack height is crucial for dispersion calculations, and knowing how to adjust these values is essential.
The Role of Stability Classes
🔒 Unlock Audio Lesson
Sign up and enroll to listen to this audio lesson

Now let’s move to stability classes and their impact on dispersion parameters σy and σz. Can someone define what a stability class is?

It refers to the atmospheric condition regarding how stable the air is, like whether it’s stable or unstable.
Exactly! Remember the Pasquill-Gifford classification? Who can list some examples of these classes?
Class A is very unstable; Class F is very stable!
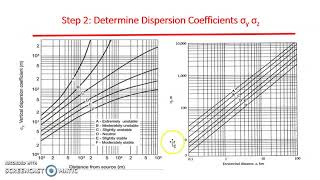
Correct! More unstable conditions promote more dispersion, while stable conditions reduce it significantly. How do we obtain σy and σz using stability classes?
We use graphs and tables that relate these classes with specific dispersion estimates!
Correct again! Understanding these relationships is key to predicting pollutant dispersion accurately.
Estimating Plume Rise and Its Effects
🔒 Unlock Audio Lesson
Sign up and enroll to listen to this audio lesson
Next up is the plume rise. Who can explain what causes a plume to rise after it exits the stack?
Mainly due to buoyancy! Hot gases will rise, right?
Precisely! The buoyant force from the hot gases acts against gravity. We also consider the stack's exit velocity. What happens if the exit velocity is very high?
The plume rises higher before it starts to disperse?
Yes! That rise contributes significantly to how pollutants disperse downwind. Can anyone recall the components in the formula for calculating stack rise?
I think it includes the stack’s exit velocity and temperature of the gases compared to the ambient temperature.
Exactly! Remember, calculating stack rise gives us a better understanding of where to focus our impact assessments, leading to more informed environmental policies.
Introduction & Overview
Read summaries of the section's main ideas at different levels of detail.
Quick Overview
Standard
In this part, critical parameters for dispersion modeling are explored, including the relationship between wind speed at stack height and dispersion effects, the significance of stability classes, and methods for estimating plume behavior through background meteorological data. Understanding these parameters is vital for accurate environmental impact assessments.
Detailed
Detailed Summary
This section focuses on the key parameters involved in dispersion modeling, emphasizing the importance of accurately calculating these values to predict pollutant dispersion in the environment. Four main parameters are introduced:
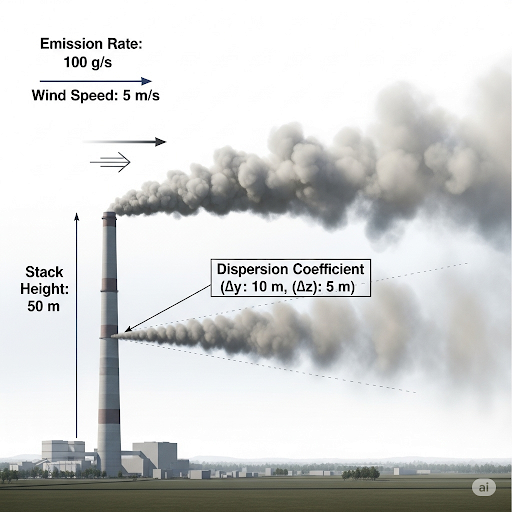
- Emission Rate (Q): The mass of pollutants released over time, typically measured in units such as kg/s.
- Wind Speed (u): The speed of wind at the height of the emissions, which significantly affects how pollutants disperse in the atmosphere. Techniques for estimating this speed, considering friction and gradient effects, are discussed.
- Stack Height (H): Represents not only the physical height of the emission source but also the impact of buoyancy and stack velocity on plume rise. This section includes formulas for calculating plume rise due to these factors.
- Dispersion Parameters (σy and σz): These parameters indicate the spread of the pollutant plume in the horizontal (y) and vertical (z) directions. Their dependence on wind stability classes is established, providing a qualitative framework for understanding dispersion behavior.
Through windrose data and stability classes, this section outlines how to derive relevant dispersion parameters, exemplifying the balance between available data and the qualitative assessments required for studies in urban environments.
Youtube Videos


Audio Book
Dive deep into the subject with an immersive audiobook experience.
Importance of Parameters in Dispersion Models
Chapter 1 of 5
🔒 Unlock Audio Chapter
Sign up and enroll to access the full audio experience
Chapter Content
So these are the parameters that we are interested in, so in order to calculate ρ (ρ, σ, H), four things are important: Q is emission rate, u is wind speed at the stack height. So this is the wind speed at stack height.
Detailed Explanation
In this section, we introduce four key parameters that are necessary for calculating the dispersion of pollutants in the atmosphere using a Gaussian model. These parameters are: 1) Q, the emission rate of pollutants, which tells us how much is released over time; 2) u, the wind speed at the height of the emission source, which affects how quickly and where the pollutants disperse; 3) H, the height of the stack that emits the pollutants; and 4) σ, which represents dispersion in the horizontal (σy) and vertical (σz) directions. Understanding these parameters is crucial for accurately modeling dispersion.
Examples & Analogies
Imagine releasing a colored smoke from a tall chimney. The amount of smoke (Q) being released, the wind speed at the chimney's height (u), the height of the chimney (H), and how the smoke spreads out (σ) will determine how far and in what direction the smoke travels. Just like understanding these aspects of smoke can help predict where it will go, knowing the parameters in the dispersion model helps scientists determine the fate of pollutants.
Calculating Wind Speed at Stack Height
Chapter 2 of 5
🔒 Unlock Audio Chapter
Sign up and enroll to access the full audio experience
Chapter Content
The first parameter, wind speed. You need to calculate wind speed at the stack height, so stack height may be 50 meters, 50 feet, 100 feet or whatever it is.
Detailed Explanation
Calculating the wind speed at the height of the emission source (the stack) is crucial because wind speed varies with height due to factors like surface friction. This means that measurements taken at ground level may not adequately represent conditions at the height of the stack. To determine the wind speed at the stack height, one can refer to nearby wind measurements and apply a mathematical equation that accounts for the wind velocity gradient. This gradient indicates how wind speed increases with height above ground due to reduced friction at higher altitudes.
Examples & Analogies
Think about standing outside on a windy day. At your feet, it feels calm because the ground slows the wind down. But if you climb a tree, you can feel the wind blowing much harder. So, when predicting how smoke from a factory disperses, it's important to know the wind speed at the height of the factory's chimney, not just at ground level.
Understanding Velocity Gradients
Chapter 3 of 5
🔒 Unlock Audio Chapter
Sign up and enroll to access the full audio experience
Chapter Content
There is a velocity gradient of air as it flows on a surface. This velocity gradient itself is a function of friction on the ground.
Detailed Explanation
The velocity of air does not remain constant as you move upwards from the ground. There is a velocity gradient caused by friction between the air and the ground. Near the Earth’s surface, air is slowed down due to this friction, while at higher altitudes, air moves more freely. This gradient impacts how pollutants disperse because the wind speed affects both the distance and direction the pollutants will travel. Understanding this gradient helps in accurately modeling dispersion patterns.
Examples & Analogies
Imagine a river flowing over rocks. Near the bank, the water moves slowly because it hits the rocks, while in the middle of the river, it flows quickly. Similarly, air moves slower near the ground and faster higher up, which is important for predicting how smoke from a chimney spreads.
Windrose: Understanding Wind Patterns
Chapter 4 of 5
🔒 Unlock Audio Chapter
Sign up and enroll to access the full audio experience
Chapter Content
Typically, what people use is Windrose for average wind directions. This windrose is a compilation of wind speed in a given area.
Detailed Explanation
A windrose is a graphical representation of wind direction and speed data collected over a certain period. It shows the average wind speeds from different directions and helps to visualize which directions are most common for wind in a specific area. By understanding the windrose, one can predict the likely dispersion of pollutants based on prevailing wind patterns. This information is vital for siting industries, assessing impacts of emissions, and designing air quality management strategies.
Examples & Analogies
Imagine a flower with petals pointing in different directions. Each petal represents how often the wind comes from that direction. Just like seeing which petals get the most sunlight can help you understand the best spots for planting, a windrose helps determine where pollutants will travel based on the wind directions they are likely to encounter.
Estimating Sigma y and Sigma z
Chapter 5 of 5
🔒 Unlock Audio Chapter
Sign up and enroll to access the full audio experience
Chapter Content
The next thing the dispersion parameters sigma z and sigma y need to be estimated. These are caused by two things one is eddies caused by turbulence in both directions y and z directions and the thermal stability class.
Detailed Explanation
Sigma y (σy) and sigma z (σz) represent the horizontal and vertical dispersion of pollutants, respectively. They are affected by turbulence in the atmosphere, which creates eddies, or swirling motion, causing particles to spread out. Additionally, thermal stability class, determined by temperature variations and atmospheric conditions, also affects how pollution disperses. Understanding these parameters allows us to predict the shape and spread of a pollutant plume in the atmosphere.
Examples & Analogies
Consider throwing a handful of confetti into the air. If it's windy (turbulence), the confetti spreads out in all directions. Similarly, thermal conditions can either promote or hinder the rise and spread of pollutants. Recognizing how these factors influence dispersion allows for better predictions of where and how pollutants will be distributed in the environment.
Key Concepts
-
Emission Rate (Q): The mass per unit time at which pollutants are emitted from the source.
-
Wind Speed (u): The speed of air movement at the stack height that affects pollutant dispersion.
-
Stack Height (H): The physical and effective height of the stack determining how high the plume rises.
-
Stability Classes: Classifications of atmospheric stability that characterize the dispersion of pollutants.
-
Plume Rise: The height a plume rises influenced by temperature, buoyancy, and wind speed.
Examples & Applications
Example: Estimating wind speed at a 50-meter high stack using nearby meteorological data.
Example: Analyzing stability classes to predict pollutant dispersion in urban environments.
Memory Aids
Interactive tools to help you remember key concepts
Rhymes
When the stack is tall, let the wind rise high, pollutants will dance and spread in the sky.
Stories
Imagine a smokestack that blows hot air. The higher it goes, the further it can share its load of pollution. But remember, if the air is calm, it won’t go far; it’s all about the conditions at hand!
Memory Tools
SPEE (Stack Height, Plume rise, Emission rate, and Environment) to remember the essential terms in dispersion modeling.
Acronyms
WIND (Wind speed, Effects, Near ground, Dispersion) helps to remember key dispersion concepts.
Flash Cards
Glossary
- Dispersion Model
A mathematical model used to predict the distribution of pollutants in the atmosphere.
- Wind Speed
The speed of air movement at any given height, affecting pollutant dispersion.
- Stack Height (H)
The physical height of the emission source and its impact on plume rise.
- Stability Classes
Categories that describe the stability of the atmosphere impacting dispersion patterns.
- Plume Rise
The height that a pollutant plume reaches after leaving the stack, influenced by buoyancy.
Reference links
Supplementary resources to enhance your learning experience.