
Dispersion Parameters Sigma Y and Sigma Z
Enroll to start learning
You’ve not yet enrolled in this course. Please enroll for free to listen to audio lessons, classroom podcasts and take practice test.
Interactive Audio Lesson
Listen to a student-teacher conversation explaining the topic in a relatable way.
Understanding Dispersion Parameters
🔒 Unlock Audio Lesson
Sign up and enroll to listen to this audio lesson

Today, we’re diving into the concepts of dispersion parameters, Sigma Y and Sigma Z. Can anyone tell me why these parameters are important in environmental science?

They help us understand how pollutants spread in the air.
Exactly! Sigma Y relates to the dispersion in the lateral direction, while Sigma Z pertains to vertical dispersion. We calculate these parameters to predict how and where pollutants will disperse in our environment.

How do we know the right values for Sigma Y and Sigma Z?
Great question! We estimate them based on wind speed and atmospheric stability. The stability class can influence the calculations significantly. Let's remember this with the acronym **SIMPLE**: Stability Informs Modeling Parameters for Lateral and Elevation!

What do you mean by atmospheric stability?
Atmospheric stability describes how stable or unstable the atmosphere is at a given time, influencing how pollutants disperse. We categorize this stability into different classes. We’ll delve deeper into this shortly.
Wind Speed Measurement
🔒 Unlock Audio Lesson
Sign up and enroll to listen to this audio lesson

Now let’s discuss wind speed. Why do we need to measure wind speed at the stack height specifically?

It must be different close to the ground than at the top of the stack.
Correct! Wind speed decreases nearer to the ground due to surface friction. Understanding this velocity gradient is crucial. We can use equations to estimate wind behavior at various heights; remember the rhyme: ‘**Low Wind Blows Slow**’!
And how do we know this gradient?
We usually conduct multiple measurements and fit them to the observed data, often using power law equations or logarithmic approaches.
Stability Classes
🔒 Unlock Audio Lesson
Sign up and enroll to listen to this audio lesson
The next crucial concept is stability classes. Who can tell me what stability class A indicates?
It’s extremely unstable, meaning there’s a lot of mixing in the air.
Right! And as we move towards stability class F, we encounter very stagnant air. Let’s remember: ‘**A is for Active, F is for Flat**’. Stability determines how pollutants spread.
And how does it affect our sigma values?
Changes in stability directly influence Sigma Y and Sigma Z, which then affects our pollutant dispersion assessments. Keep that connection clear!
Calculating Sigma Y and Sigma Z
🔒 Unlock Audio Lesson
Sign up and enroll to listen to this audio lesson
Lastly, let’s look at how we actually calculate Sigma Y and Sigma Z using available parameters. Can someone summarize the process?
We need wind speed, stability information, and distance from the source.
Exactly! And what’s interesting is that Sigma Y tends to vary less across stability classifications compared to Sigma Z. This tells us something about the vertical spread of the plume.
And are these calculations handy for regulators?
Indeed! They provide vital data for compliance and risk assessments in environmental management.
What about calculating plume rise?
Great point! The plume rise is impacted by temperature and velocity from the stack, which we’ll explore further in our next session. Remember the formula: **Plume height = Stack height + Buoyancy height**!
Introduction & Overview
Read summaries of the section's main ideas at different levels of detail.
Quick Overview
Standard
The section elaborates on the parameters required for calculating the density of pollutants in the atmosphere, particularly focusing on Sigma Y and Sigma Z. Key factors influencing these parameters include wind speed, stack height, and atmospheric stability, along with formulas and methods utilized to derive estimates for dispersion modeling.
Detailed
Detailed Summary
This section focuses on dispersion parameters Sigma Y and Sigma Z, critical elements in the Gaussian dispersion model used for assessing atmospheric pollutants. The chapter outlines the essential factors needed to calculate pollutant density, namely emission rate (Q), wind speed (u), stack height (H), and the dispersion parameters (σy and σz). The significance of knowing wind speed at stack height is stressed, as this influences how pollutants disperse.
Key Concepts:
- Wind Speed: Wind speed is typically measured at various heights and shows a gradient due to surface friction, with lower speeds nearer the ground. The calculation of wind speed at the stack height is pivotal to ensuring the accuracy of dispersion models.
- Velocity Gradient: Understanding the velocity gradient aids in estimating wind speed at different heights, which can be represented using power-law or logarithmic equations.
- Stability Classes: The section introduces Pasquill and Gifford's stability classes to classify atmospheric conditions that affect pollutant dispersion. Classifications range from extremely unstable to stable, influencing the shape and extension of the pollutant plume.
- Dispersion Parameters: Sigma Y and Sigma Z are estimated based on wind speed and stability classes. Their calculation considers turbulence and thermal stability, essential for predicting how pollutants spread from their source.
- Stack Rise: The document highlights how the stack rise, influenced by temperature and stack exit velocity, affects the plume and dispersion parameters.
This section emphasizes the foundational role of fetch data and environmental conditions in understanding pollutant dissemination, ensuring accurate assessments in environmental monitoring.
Youtube Videos


Audio Book
Dive deep into the subject with an immersive audiobook experience.
Importance of Dispersion Parameters
Chapter 1 of 6
🔒 Unlock Audio Chapter
Sign up and enroll to access the full audio experience
Chapter Content
Next, the dispersion parameters sigma y and sigma z need to be estimated, caused by eddies from turbulence in both directions as well as the thermal stability class.
Detailed Explanation
Dispersion parameters, sigma y and sigma z, play crucial roles in determining how pollutants spread in the atmosphere. These parameters are influenced by two main factors: turbulence, which generates small swirling motions (eddies) in the air that enhance mixing, and thermal stability, which describes the atmosphere's ability to disperse heat and pollutants. Understanding these parameters is essential for predicting the behavior of emissions from sources like smokestacks.
Examples & Analogies
Imagine throwing a drop of food coloring into a glass of water. If you stir the water, it spreads rapidly, representing turbulence. However, if the water is still, the coloring spreads slowly and unevenly, representing a stable atmosphere. Just like the food coloring, pollution disperses more effectively in a turbulent atmosphere.
Thermal Stability Classes
Chapter 2 of 6
🔒 Unlock Audio Chapter
Sign up and enroll to access the full audio experience
Chapter Content
A classification system for thermal stability, developed in the 1950s and 1960s by Pasquill and Gifford, defines stability classes which are still useful for estimating dispersion parameters.
Detailed Explanation
The thermal stability classification system categorizes the atmosphere based on factors like solar radiation and wind speed. For instance, clear, sunny days may lead to unstable air (where pollutants rise), while overcast, calm nights may result in stable conditions (where pollutants linger close to the source). Each stability class is linked to specific ranges of sigma y and sigma z.
Examples & Analogies
Think of stability classes like different weather moods. On a windy and sunny day, the air is lively and chaotic (unstable), dispersing heat and smells quickly like a party atmosphere where everyone is dancing. On a calm, cloudy night, it feels peaceful and quiet (stable), keeping things still like a sleeping city.
Measuring Wind and Dispersion
Chapter 3 of 6
🔒 Unlock Audio Chapter
Sign up and enroll to access the full audio experience
Chapter Content
To utilize these stability classes, one needs to measure wind speed and conditions. This data can then determine sigma y and sigma z by using charts provided in stability guidelines.
Detailed Explanation
Accurate wind speed measurements at varying heights are essential for determining how pollutants will disperse over distances. By learning about stability and correlating it to sigma y and sigma z values from charts, one can predict the width and height of pollutant plumes as they travel through the air. For instance, higher wind speeds can lead to broader dispersal.
Examples & Analogies
It's like preparing to launch a kite. You need to know how strong the wind is to decide how high and far your kite can fly. If it's a strong wind, your kite will soar high and far, representing a larger dispersion of pollutants in the air.
Dispersion Variations with Stability Class
Chapter 4 of 6
🔒 Unlock Audio Chapter
Sign up and enroll to access the full audio experience
Chapter Content
As distances from the emission source increase, the sigma y dispersion grows steadily, while sigma z shows significant variability based on stability class.
Detailed Explanation
As pollutants move away from their source, they tend to spread wider horizontally (sigma y) while their vertical dispersion (sigma z) varies greatly with atmospheric stability. In stable conditions (like at night), pollutants stay close to the ground, but in unstable conditions, they can rise higher, leading to less concentration at ground level.
Examples & Analogies
Imagine blowing up a balloon. As you blow air into it, it expands (like sigma y), but if you release it, it might shoot up into the sky (like changes in sigma z). How high or low this goes depends significantly on the surrounding air's stability and conditions.
Estimating Stack Height and Rise
Chapter 5 of 6
🔒 Unlock Audio Chapter
Sign up and enroll to access the full audio experience
Chapter Content
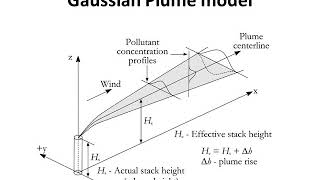
The parameter H represents the effective height of emissions, which includes both the physical height of the stack and the rise of the plume due to thermal effects.
Detailed Explanation
Effective height (H) is crucial for predicting where pollutants will travel. It accounts for both the actual height of the emission source (like a chimney) and the plume's rise caused by warm gases that move upwards due to buoyancy. This gives a complete picture of how and where pollution disperses in the environment.
Examples & Analogies
Think of H like a hot air balloon. The actual height of the balloon is important, but it also rises higher due to the hot air inside. Just as the hot air makes the balloon go up, warm emissions cause the plume to rise into the atmosphere before being carried by the wind.
Factors Influencing Plume Rise
Chapter 6 of 6
🔒 Unlock Audio Chapter
Sign up and enroll to access the full audio experience
Chapter Content
The plume rise depends on both the velocity at which emissions are expelled from the stack and the temperature difference between the emissions and the surrounding air.
Detailed Explanation
The plume's rise is driven by how fast the emissions exit the stack and their temperature relative to the ambient air. Warmer emissions rise quicker because they are lighter than cooler air. This upward movement helps in mixing the pollutants higher into the atmosphere, impacting where they will settle.
Examples & Analogies
Consider how smoke from a campfire rises when you first light it up. If you blow air into the fire (increasing the velocity), the smoke moves higher faster, similar to how hot air helps pollutant plumes rise beyond their source.
Key Concepts
-
Wind Speed: Wind speed is typically measured at various heights and shows a gradient due to surface friction, with lower speeds nearer the ground. The calculation of wind speed at the stack height is pivotal to ensuring the accuracy of dispersion models.
-
Velocity Gradient: Understanding the velocity gradient aids in estimating wind speed at different heights, which can be represented using power-law or logarithmic equations.
-
Stability Classes: The section introduces Pasquill and Gifford's stability classes to classify atmospheric conditions that affect pollutant dispersion. Classifications range from extremely unstable to stable, influencing the shape and extension of the pollutant plume.
-
Dispersion Parameters: Sigma Y and Sigma Z are estimated based on wind speed and stability classes. Their calculation considers turbulence and thermal stability, essential for predicting how pollutants spread from their source.
-
Stack Rise: The document highlights how the stack rise, influenced by temperature and stack exit velocity, affects the plume and dispersion parameters.
-
This section emphasizes the foundational role of fetch data and environmental conditions in understanding pollutant dissemination, ensuring accurate assessments in environmental monitoring.
Examples & Applications
Using wind speed measurements from a tower to estimate Sigma Y and Sigma Z for a nearby factory's emissions.
Calculating the plume rise for a stack emitting at high temperature and velocity, assessing its effect on pollutant dispersion.
Memory Aids
Interactive tools to help you remember key concepts
Rhymes
For plumes that sway and shift wide, Sigma Y reflects the lateral ride.
Stories
Once upon a time, in a bustling city, the wind loved to play with the air, carrying the tiny particles from the factories away, up into the sky. The brave little Sigma Y told the world, 'I’ll measure how wide the plume spreads,' while Sigma Z would announce quietly, 'And I’ll measure how high we fly!'
Memory Tools
Remember: S - Stacks, W - Wind, E - Effects. Think of the wind and how it affects stack released emissions.
Acronyms
SWEEP
for Stack height
for Wind speed
for Edges of dispersion
for Environmental conditions
and P for Parameters (Sigma Y and Sigma Z).
Flash Cards
Glossary
- Sigma Y
The parameter representing the lateral dispersion of a pollutant plume.
- Sigma Z
The parameter representing the vertical dispersion of a pollutant plume.
- Wind Speed
The speed of air movement measured at specific heights.
- Stability Classes
Categories that describe atmospheric conditions affecting pollutant dispersion.
- Plume Rise
The height a pollutant plume rises above the stack due to buoyancy and velocity.
Reference links
Supplementary resources to enhance your learning experience.