
Environmental Quality: Monitoring and Analysis
Enroll to start learning
You’ve not yet enrolled in this course. Please enroll for free to listen to audio lessons, classroom podcasts and take practice test.
Interactive Audio Lesson
Listen to a student-teacher conversation explaining the topic in a relatable way.
Dispersion Parameters
🔒 Unlock Audio Lesson
Sign up and enroll to listen to this audio lesson

Today, we’ll explore the key dispersion parameters in environmental monitoring! Can anyone name the parameters we need to consider?

Is it the emission rate and wind speed?
Exactly! We also need to include the height of the stack and the dispersion coefficients like σ in the y and z directions. Remember the acronym QUSH for those parameters.

What does QUSH stand for again?
QUSH stands for: Q - Emission rate, U - Wind speed, S - Stack height, and H - Dispersion coefficients. Keep that handy!

Are the dispersion coefficients the same in both directions?
Good question! They can differ, and typically, they increase with distance from the source, affecting how pollutants spread.

So how is wind speed at the height of the stack determined?
We use anemometers to measure it at various heights due to the velocity gradient near the ground. Let’s move on to that next!
Windrose and Wind Patterns
🔒 Unlock Audio Lesson
Sign up and enroll to listen to this audio lesson

Next, we’ll examine how to interpret windrose diagrams. What do you think a windrose shows?
Doesn’t it show wind directions and speeds over a period?
Exactly! It allows us to assess the average wind conditions in an area. Remember, it plots wind as coming from a direction, not going towards it.
What about the colors represent?
The colors indicate the wind speed magnitude, with red typically representing the highest speeds. This helps identify how often certain wind speeds come into play.
How is this useful for locating factories?
By understanding where pollutants might spread based on the predominant wind directions, we can make informed decisions on factory placement.
So the windrose helps prevent pollution issues, right?
Absolutely! It's a critical tool for optimizing environmental impact assessments. Let’s go further into how atmospheric stability affects dispersion.
Stability Classes
🔒 Unlock Audio Lesson
Sign up and enroll to listen to this audio lesson
Now, let’s delve into stability classes. What do you think they are based on?
Are they related to weather conditions like sunny or cloudy?
Exactly! They define how stable the atmosphere is, which affects how pollutants disperse. We categorize these as A through F. Can anyone give me an example?
A sunny day would be classified as something like unstable?
Correct! Stability class A is extremely unstable, while classes near F indicate stable conditions, reducing dispersal. It’s critical for determining parameters like sigma y and sigma z.
So how do we use this information?
We use it to input accurate values in dispersion models and make predictions on pollutant behavior. This leads us to examine how stack height plays into all of this.
Stack Rise and Emission Rate
🔒 Unlock Audio Lesson
Sign up and enroll to listen to this audio lesson
Finally, we’ll cover stack rise and the emission rate. Why is the stack height significant?
It affects how far the plume can rise before spreading out.
Exactly! Stack rise results from both buoyancy and stack velocity. It significantly influences our dispersion calculations.
What about the emission rate? How is that determined?
We calculate it using an emission factor multiplied by an activity rate. This means the type of fuel and how much is burned greatly impact the emissions.
Is there a standard rate for emissions?
Yes, emission factors are specific to processes, with variations for different fuels. Knowing both factors ensures we model accurately.
So can we summarize what we've learned today?
Certainly! We discussed dispersion parameters, windrose use in planning, stability classes, stack behavior, and emission rates, all essential for effective environmental assessments.
Introduction & Overview
Read summaries of the section's main ideas at different levels of detail.
Quick Overview
Standard
The section provides an overview of critical parameters essential for dispersion modeling in environmental quality analysis. It discusses the importance of wind parameters, the height of stacks, and how stability classes affect environmental dispersion, alongside evaluating wind data through tools like the windrose.
Detailed
Environmental Quality: Monitoring and Analysis
The section elaborates on the parameters crucial for calculating dispersion in environmental assessments, specifically focusing on Gaussian dispersion models. Key aspects include:
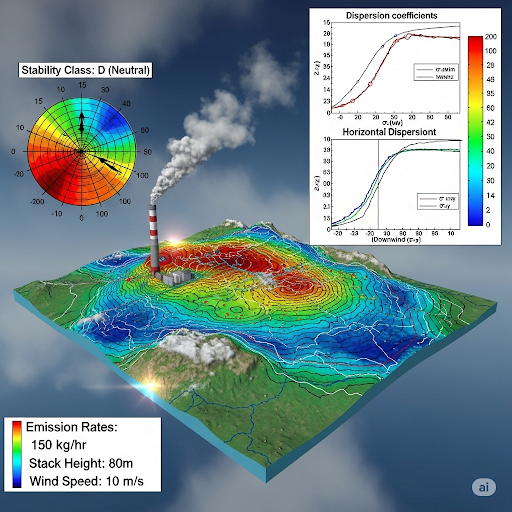
- Dispersion Parameters: The section highlights four essential parameters: emission rate (Q), wind speed (u), stack height (H), and dispersion coefficients (σ in y and z directions). These variables are fundamental in establishing the concentration of pollutants in the environment.
- Wind Speed Measurements: Understanding wind speed at stack height is crucial due to the velocity gradient present close to the ground, primarily influenced by surface friction. The section delves into different equations (including power law and logarithmic models) that describe these relationships.
- Windrose Diagrams: Windrose provides a visual representation of wind speed and direction over time, helping to understand prevailing wind patterns crucial for dispersion modeling. The section clarifies how to interpret windrose and its importance in planning industrial locations to mitigate pollution impacts.
- Stability Classes: Classification of atmospheric conditions by stability classes aids in estimating dispersion parameters such as σ_y and σ_z due to turbulence and thermal stability.
- Stack Rise and Emission Rate: The section concludes with a discussion on stack rise, detailing how the combination of stack height and plume characteristics affects dispersion, and emphasizes the role of precise emission rate calculations for accurate modeling.
Overall, the section synthesizes key concepts surrounding dispersion monitoring, emphasizing the integral relationship between meteorological data and environmental analysis.
Youtube Videos


Audio Book
Dive deep into the subject with an immersive audiobook experience.
Key Parameters for Dispersion Modelling
Chapter 1 of 7
🔒 Unlock Audio Chapter
Sign up and enroll to access the full audio experience
Chapter Content
So these are the parameters that we are interested in, so in order to calculate ρ (σ, σy, H), four things are important: Q is emission rate, u is wind speed at the stack height. H is the height of the stack and σ and σ in y and z directions.
Detailed Explanation
In dispersion modelling, to understand how pollutants spread in the environment, we focus on key parameters. The emission rate (Q) indicates how much pollution is being released over time. Wind speed (u) at the height of the stack helps us understand how quickly this pollutant will move in the air. The height of the stack (H) is crucial because it determines how high the pollutants are released into the atmosphere, affecting their dispersion. Finally, σy and σz are measures of how much the pollutant spreads horizontally and vertically, respectively.
Examples & Analogies
Imagine a perfume bottle being sprayed in a room. The emission rate is how much perfume is released from the bottle over time. The wind speed represents the breeze created by a fan, which can help spread the scent around the room. The height of the spray nozzle indicates how high the perfume can reach, and σy and σz describe how the scent spreads out horizontally and vertically.
Understanding Wind Speed Measurement
Chapter 2 of 7
🔒 Unlock Audio Chapter
Sign up and enroll to access the full audio experience
Chapter Content
You need to calculate wind speed at the stack height, so stack height may be 50 meters, 50 feet, 100 feet or whatever it is. There is also the observation that typically wind speed is affected by the height where it is measured due to the velocity gradient of air flow.
Detailed Explanation
When we measure wind speed, it's important to note that it changes with height. Near the ground, due to friction with the surface, wind speed is usually slower compared to higher up. This means if we measure wind speed at a nearby airport, we need to adjust it to estimate the speed at our stack's height. The adjustment is often based on a velocity gradient, which can be calculated using equations that describe how wind flow behaves at different heights.
Examples & Analogies
Think of how a kite behaves on a windy day. At ground level, the wind might be gentle, but as you rise higher, the wind can be much stronger. If you're flying a kite from a hill, you might find that it can catch a stronger breeze than when standing on flat ground.
Velocity Gradient and Its Importance
Chapter 3 of 7
🔒 Unlock Audio Chapter
Sign up and enroll to access the full audio experience
Chapter Content
The velocity gradient of air as it flows on a surface is crucial since friction with the ground decreases wind speed lower down compared to above. This gradient helps us estimate wind speed at different heights.
Detailed Explanation
The velocity gradient refers to how wind speed varies with height because of the ground's surface friction. As you move away from the ground, the friction lessens, and wind speed typically increases. This concept is vital for accurately estimating how pollutants will disperse if we only measure wind speeds at lower levels.
Examples & Analogies
Imagine riding a bicycle. On a calm road (ground level), you might feel little resistance. But as you go downhill, you gain speed effortlessly, similar to how wind speeds up at higher altitudes due to less friction.
Using Windrose for Understanding Wind Patterns
Chapter 4 of 7
🔒 Unlock Audio Chapter
Sign up and enroll to access the full audio experience
Chapter Content
Typically, what people use is Windrose for average wind directions. This windrose is a compilation of wind speed in a given area, and it indicates how wind patterns change over time.
Detailed Explanation
A Windrose is a graphical tool that displays the average frequency and direction of winds in a specific area over a period (e.g., a month or year). By analyzing this data, we can understand where winds mainly come from and how strong they are, which is essential for determining the possible dispersion of pollutants.
Examples & Analogies
Think of a windmill. A windrose tells us from which direction the wind is blowing predominantly, allowing the windmill to adjust its blades for maximum efficiency. If you only know that the wind generally comes from the east, you can better place the windmill to harness that energy.
Impact of Stability Classes on Dispersion
Chapter 5 of 7
🔒 Unlock Audio Chapter
Sign up and enroll to access the full audio experience
Chapter Content
The dispersion parameters sigma z and sigma y need to be estimated and are affected by turbulence in both directions y and z and by the thermal stability class.
Detailed Explanation
Dispersion parameters σy and σz describe how pollutants spread out horizontally and vertically. These parameters depend on environmental conditions like turbulence and thermal stability, which dictate how mixing occurs in the atmosphere. Understanding these factors helps in accurately modelling how pollutants disperse under varying conditions.
Examples & Analogies
Imagine making a smoothie. If you blend fast (high turbulence), the ingredients mix quickly and evenly. If you blend slowly (low turbulence), some ingredients may remain clumpy. Similarly, the atmosphere mixes pollutants based on turbulence and stability.
Calculating Stack Rise
Chapter 6 of 7
🔒 Unlock Audio Chapter
Sign up and enroll to access the full audio experience
Chapter Content
The effective height (H) of the plume is affected by the stack height and the rise due to buoyancy and velocity of the emitted gases.
Detailed Explanation
The height at which pollutants are released (stack height) influences how far they can travel before they disperse. The plume's rise can be affected by factors like the temperature of the gases released (hotter gases rise more) and the velocity at which they exit the stack. This combined height helps in accurately modeling how pollutants will disperse in the air.
Examples & Analogies
When you heat a balloon, the hot air inside causes it to rise. Similarly, when gases released from a stack are hot and moving rapidly, they rise higher in the atmosphere before cooling and dispersing.
Understanding Emission Rate
Chapter 7 of 7
🔒 Unlock Audio Chapter
Sign up and enroll to access the full audio experience
Chapter Content
Emission rate is computed by multiplying the emission factor (mass of pollutant per unit activity) by the total activity rate.
Detailed Explanation
The emission rate is a crucial component in dispersion modelling, representing how much of a pollutant is released into the atmosphere over a specific time. It is calculated using an emission factor, which indicates how much pollutant is produced for a certain activity (like burning coal), multiplied by the total amount of that activity (like how much coal is burned daily). This rate helps determine the potential impact of the pollutants.
Examples & Analogies
Consider baking cookies. The recipe might say that each cookie has a certain amount of chocolate chips (emission factor). If you make several batches (activity rate), you can calculate how many total chocolate chips you'll use, similar to calculating total emissions.
Key Concepts
-
Dispersion Parameters: Essential for predicting pollutant concentrations in the environment.
-
Windrose: A crucial tool for determining prevailing wind patterns and assessing their impact on emissions.
-
Stability Classes: Important for understanding atmospheric conditions that affect dispersion.
-
Plume Rise: The height to which pollutants can ascend before dispersing, influenced by stack height and buoyancy.
Examples & Applications
If a factory emits pollutants and the predominant wind direction is towards a residential area, understanding dispersion through windrose becomes crucial for safety planning.
Using stability classes, an engineer can categorize severe weather conditions, such as a stable atmosphere during a winter night, and adjust emissions strategies accordingly.
Memory Aids
Interactive tools to help you remember key concepts
Rhymes
To help the air, pollutants must rise, with wind direction to equalize.
Stories
Imagine a factory that releases clean air, rising high above it without a care; it twists and turns, under the sun, creating changes before it’s done.
Memory Tools
Remember QUSH: Q for emission, U for wind speed, S for stack height, H for dispersion.
Acronyms
QUSH
Parameters - Q for Emission rate
for Wind speed
for Stack height
for Dispersion coefficients.
Flash Cards
Glossary
- Emission Rate
The mass of a pollutant emitted per unit time, crucial for dispersion modeling.
- Wind Speed
The speed of wind measured at stack height, impacting dispersion of pollutants.
- Stack Height
The height of the emission source, influencing where pollutants are released into the atmosphere.
- Dispersion Coefficients
Parameters (σ_y and σ_z) that determine how pollutants spread in the environment.
- Windrose
A graphical representation showing wind patterns, speeds, and directions over a specific time.
- Stability Classes
Categories that describe atmospheric stability based on weather conditions, affecting pollutant dispersion.
- Plume Rise
The extent to which a plume of pollutants rises into the atmosphere before dispersing.
Reference links
Supplementary resources to enhance your learning experience.