
Emergency Response Planning Using Dispersion Modeling
Enroll to start learning
You’ve not yet enrolled in this course. Please enroll for free to listen to audio lessons, classroom podcasts and take practice test.
Interactive Audio Lesson
Listen to a student-teacher conversation explaining the topic in a relatable way.
Understanding Gaussian Dispersion Modeling
🔒 Unlock Audio Lesson
Sign up and enroll to listen to this audio lesson

Today, we're exploring Gaussian dispersion modeling, which is crucial for estimating pollutant concentrations from sources like industrial stacks. Can anyone tell me why this modeling is vital for environmental quality?

Is it to assess air pollutants and protect public health?
Exactly! The model helps us predict the concentration at various distances from the source. For example, what if we need to know the concentration of sulfur dioxide at 50 meters versus 500 meters from a stack?

We would need to calculate it using the model, right?
Correct! Remember, this involves using specific parameters like stack height and emission rates. A good mnemonic to remember the parameters we need is 'SIMPLE' - Stack height, Immission rate, Meteorological data, Pollution type, Location, and Environmental conditions.

What about the stability classes? How do they affect our calculations?
Great question! Stability classes categorize atmospheric conditions. For instance, Class D represents overcast conditions, which affects how pollutants disperse. Knowing this can change our concentration estimates significantly.
In summary, understanding these models helps in planning emergency responses effectively. Remember SIMPLE when recalling important parameters.
Application of Dispersion Models in Emergency Response
🔒 Unlock Audio Lesson
Sign up and enroll to listen to this audio lesson

Now, let’s discuss how we apply dispersion models for emergency response planning. Why is it important to know where pollutants may spread?

To protect people and minimize harm in case of a leak or accident.
Exactly! By mapping where pollutants will go, we can identify at-risk areas. Following a leak, we can delineate danger zones using contour maps. Who can explain what an isopleth is?
An isopleth is a line on a map connecting points of equal pollutant concentration.
Right again! Isopleths help us visualize the extent of pollution spread. Considering these maps, how could they assist emergency responders?
Responders can prioritize evacuations or resource allocation in the most affected areas.
Absolutely. In high-risk scenarios, knowing which areas to target first is essential for effective response. Keep in mind, worst-case scenarios are vital to ensure preparedness.
Real-World Implications of Dispersion Models
🔒 Unlock Audio Lesson
Sign up and enroll to listen to this audio lesson
Let’s shift our focus to how dispersion models can influence where we place industrial facilities. Why would this be important?
To minimize pollution impact on residential areas and ensure public safety.
Exactly! Placing industries far from populated areas reduces risk. What’s one challenge we face when siting industries?
Urban sprawl! If industries are near residential areas, we’ll have more people exposed to pollution.
True! That's why vocal public discourse and regulatory frameworks are critical as cities expand. Remember, precautionary principles should always guide industrial siting decisions.
In closing, our understanding of dispersion modeling not only aids in emergency response but shapes urban planning and industrial policies. A take-home acronym to remember this is 'SAFE' - Siting, Awareness, Forecasting, and Emergency planning.
Introduction & Overview
Read summaries of the section's main ideas at different levels of detail.
Quick Overview
Standard
The section elaborates on how Gaussian dispersion modeling can be utilized to assess air quality by estimating the concentration of pollutants emitted from sources. It discusses the importance of understanding dispersion patterns for emergency response planning, describing how to map pollutant distributions for effective public health measures.
Detailed
Detailed Summary
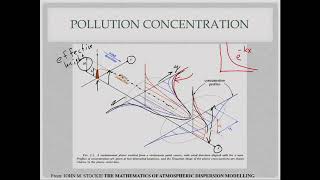
This section emphasizes the critical role of dispersion modeling in environmental management, particularly when assessing air quality and planning for emergency responses. Gaussian dispersion models allow practitioners to estimate the concentration of pollutants, such as sulfur dioxide (SO₂), released from industrial stacks at various distances from the source. By applying this model, one can evaluate different stability classes - determined by weather conditions - and incorporate specific parameters such as stack height and emission rates.
The discussion includes examples involving calculations of pollutant concentrations at ground level and emphasizes the necessity of understanding crosswind effects. By defining a grid of coordinates (receptors), various receptor points can be analyzed for pollutant exposure.
Furthermore, the section details scenarios for emergency planning, including how to monitor areas affected by industrial emissions and how to identify neighborhoods at risk in case of chemical leaks. The development of contour maps through isopleths is explained, offering visual representations of pollutant dispersion. This comprehensive approach highlights the importance of planning for worst-case scenarios and emphasizes the continuous need for accurate data to ensure public safety during environmental emergencies.
Youtube Videos


Audio Book
Dive deep into the subject with an immersive audiobook experience.
Introduction to Emergency Response Planning
Chapter 1 of 5
🔒 Unlock Audio Chapter
Sign up and enroll to access the full audio experience
Chapter Content
Emergency response planning is crucial for identifying areas that may be affected by pollutants during an incident. For instance, if there's an industrial leak, knowing how to predict the pollutant spread can save lives.
Detailed Explanation
Emergency response planning involves preparing for potential accidents or leaks that can release pollutants into the environment. By using dispersion modeling, we can estimate where these pollutants might spread based on factors like wind direction, speed, and the type and quantity of the substance released. This allows authorities to plan how to protect people in the areas most at risk.
Examples & Analogies
Imagine a factory handling hazardous chemicals. If a leak occurs, instead of guessing which neighborhoods might be affected, officials use dispersion models to simulate and visualize the spread of chemicals in the air. This enables them to quickly warn those in high-risk areas, much like weather services warn about approaching storms.
Understanding Worst-Case Scenarios
Chapter 2 of 5
🔒 Unlock Audio Chapter
Sign up and enroll to access the full audio experience
Chapter Content
In emergency response, planners evaluate worst-case scenarios to ensure readiness. This includes understanding factors like wind behavior during extreme events.
Detailed Explanation
Planners use worst-case scenarios to prepare for the most dangerous situations that could occur during an industrial accident. They analyze extreme weather patterns, like a strong cyclone, to understand how rapidly pollutants might disperse and what areas would be impacted the most. This thorough preparation helps organizations develop a robust emergency response strategy.
Examples & Analogies
Think of emergency responders as firefighters preparing for the worst. Just as a firefighter would familiarize themselves with the layout of a building to plan their response, emergency planners simulate potential disasters to figure out the best way to evacuate and protect communities in case of an accident.
Using Windrose Data
Chapter 3 of 5
🔒 Unlock Audio Chapter
Sign up and enroll to access the full audio experience
Chapter Content
Windrose data helps in predicting pollutant dispersion by indicating how wind varies at different times and directions.
Detailed Explanation
Windrose data contains important information about wind speed and direction patterns, showing how winds typically behave in a region. By analyzing this data, planners can anticipate where pollutants from a leak might travel, enabling them to focus their response efforts effectively.
Examples & Analogies
Imagine sailing on a boat. A sailor checks the wind direction to know how to set the sails. Similarly, emergency planners use windrose data to catch the most accurate direction pollutants will blow during a leak, allowing them to direct resources where they're needed most.
Impact on Urban Development and Industry Location
Chapter 4 of 5
🔒 Unlock Audio Chapter
Sign up and enroll to access the full audio experience
Chapter Content
Dispersion modeling assists in determining safe locations for industries, ensuring they are situated far from residential areas.
Detailed Explanation
Dispersion modeling is vital when planning where to place new industries. By analyzing how pollutants might spread, planners can make informed decisions to site factories away from populated areas. This minimizes the risk of exposure to harmful emissions for the public, ensuring both safety and compliance with health regulations.
Examples & Analogies
Consider a new restaurant planning to install a kitchen exhaust. The owners would want to understand how the smell and potential smoke will disperse. By using dispersion modeling, they can ensure that their kitchen is not located near an apartment complex, just like industries must be strategically placed to protect nearby residents.
Sighting of Industry Plans
Chapter 5 of 5
🔒 Unlock Audio Chapter
Sign up and enroll to access the full audio experience
Chapter Content
Industries are often placed far from urban areas based on dispersion models to prevent exposure from emissions.
Detailed Explanation
To safeguard health and environment, industries are frequently sited away from population centers using dispersion modeling data. This approach helps planners predict how emission concentrations decrease with distance and ensures that pollutants don't significantly affect those living nearby.
Examples & Analogies
Imagine a factory producing high levels of smoke similar to how a barbecue produces smells. If the grill is too close to the house, the smell can be overwhelming. Planners use dispersion models to ensure factories emit pollutants at a distance where they won’t reach homes, keeping communities safe.
Key Concepts
-
Impact Assessment: Understanding the effects of pollutants on air quality and public health.
-
Safety Planning: Using data from dispersion models to prepare for chemical leaks and public safety.
-
Industry Siting: Considerations for where industries are placed to minimize exposure to populations.
Examples & Applications
Calculating SO₂ concentration 50m and 500m from a stack to evaluate ambient air quality.
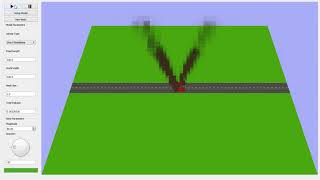
Creating contour maps to visualize pollution spread around an industrial area.
Memory Aids
Interactive tools to help you remember key concepts
Rhymes
In the air, pollutants stray, through Gaussian models, we find their way.
Stories
Imagine a city where factories blow smoke, a wise planner uses models to ensure people have hope.
Memory Tools
Remember 'SIMPLE' for Gaussian Model parameters: Stack height, Immission rate, Meteorological data, Pollution type, Location, Environmental conditions.
Acronyms
In emergency planning, think 'SAFE'
Siting industries
Awareness of pollution
Forecasting effects
Emergency preparedness.
Flash Cards
Glossary
- Gaussian Dispersion Model
A mathematical model used to estimate the concentration of pollutants in the atmosphere based on emission rates and meteorological data.
- Stability Class
Categories that describe atmospheric stability based on meteorological conditions, affecting pollutant dispersion.
- Isopleth
A line on a map connecting points of equal concentration of a substance.
- Contour Map
A graphical representation of the concentration distribution in a given area indicating potential impact zones.
Reference links
Supplementary resources to enhance your learning experience.