
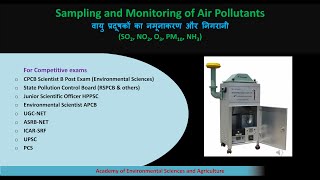
Illustration of SO Emission from a Stack
Enroll to start learning
You’ve not yet enrolled in this course. Please enroll for free to listen to audio lessons, classroom podcasts and take practice test.
Interactive Audio Lesson
Listen to a student-teacher conversation explaining the topic in a relatable way.
Introduction to SO Emission and Gaussian Dispersion Model
🔒 Unlock Audio Lesson
Sign up and enroll to listen to this audio lesson

Today, we're going to explore the concept of sulfur dioxide emission from stacks and how we can use the Gaussian dispersion model to calculate concentrations at various distances. Can anyone tell me what we mean by 'Gaussian dispersion model'?

Isn't it a model that helps us estimate how pollutants spread in the air?
Exactly! It's used to predict the concentration of pollutants based on distance from the source and meteorological conditions. We will look at a specific example assessing SO₂ concentration at 50 meters and 500 meters from the stack.

What factors do we need to consider for these calculations?
Good question! We need to consider emission rate, stack height, atmospheric stability, and wind conditions. We often refer to the emission rate as Q and the height as H. Remember, understanding these parameters is crucial!

What happens if the conditions change, like if the wind speed increases?
That's important! Changing wind conditions can affect dispersion. We categorize atmospheric stability into classes, like class D for slightly unstable conditions, which can impact our calculated concentrations. Let's summarize: model parameters are critical for accurate predictions.
Calculation of Concentration Using the Dispersion Model
🔒 Unlock Audio Lesson
Sign up and enroll to listen to this audio lesson

Now let's move to the actual calculations. For instance, when estimating SO₂ concentration at 500 meters downwind from a stack, we utilize the formula we discussed. Who can remind us what variables we need?
We need Q, H, stability class, and wind speed!
Right! And our calculation will lead us to a concentration value, say 66 micrograms per cubic meter. This helps us understand the impact on air quality. What do you think influences the accuracy of our results here?

I guess if we estimate different stability classes, that could change our results.
Yes! Different stability classes can lead to significantly varying concentration estimates, showing just how vital correct assumptions are. Always check stability in your context.
Impact of Multiple Sources and Contour Mapping
🔒 Unlock Audio Lesson
Sign up and enroll to listen to this audio lesson
As we look at multiple sources emitting pollutants, we use the superposition principle. Can anyone explain what that means in this context?
It means we add together the contributions of different emission sources at a single point, right?
Exactly! Then, we can visualize the cumulative impact on air quality with contour maps, known as isopleths. What advantages do these maps provide us?
They help us see the areas most affected by pollution!
Correct! That’s crucial for planning emergency responses and understanding potential exposure risks. Always consider visualizing your data.
Real-world Applications of Dispersion Modeling
🔒 Unlock Audio Lesson
Sign up and enroll to listen to this audio lesson
Finally, let's talk about how we use these dispersion models in real life. One significant application is in emergency response planning. Why do you think this is key?
It helps identify which areas could be affected by high concentrations of pollutants during an incident, so we know who to warn.
Exactly! Effective planning can save lives. Additionally, industries must also consider the location of their emissions sources relative to population centers. What factors do you think are important here?
They need to ensure the wind patterns won’t carry pollutants to residential areas.
Absolutely! Understanding dispersion can guide industries to avoid placing sources too close to populated areas. Remember, mapping and understanding dispersion behavior can help regulate air quality efficiently.
Introduction & Overview
Read summaries of the section's main ideas at different levels of detail.
Quick Overview
Standard
The chapter highlights the use of the Gaussian dispersion model to estimate SO₂ concentrations at 50 and 500 meters from a stack. It also introduces factors that influence estimation including stability classes, and the impact of multiple sources on pollutant concentration, along with practical applications in environmental monitoring and emergency response planning.
Detailed
Detailed Summary
This section provides an illustration of how to estimate sulfur dioxide (SO₂) emissions from a stack using the Gaussian dispersion model. The focus is on calculating the concentration at specified distances (50 and 500 meters) under the assumption of certain environmental conditions, checked against the stability class of the atmosphere.
Key Concepts Covered:
- Gaussian Dispersion Model: A mathematical model used to estimate the concentration of pollutants in the atmosphere based on emissions from a point source (the stack) considering distance from the source, atmospheric stability, and other factors.
- Emission Parameters: The relevant parameters needed for the computation, such as the emission rate (Q), stack height (H), and stability classes (e.g., class D for slightly unstable conditions).
- Calculations: Detailed steps for performing calculations to determine concentration at a ground level, factoring in different coordinates (crosswind and downwind) for comprehensive assessments.
- Superposition of Sources: The methodology for assessing multiple emissions sources and their collective impact on air quality by adding up contributions from each source.
- Mapping and Contour Representation: The importance of visualizing pollutant concentrations using contour maps (isopleths) to guide emergency response and urban planning decisions. The region around a pollution source can be mapped to identify areas at risk based on emission rates and meteorological conditions.
- Emergency Response Planning: Practical applications of dispersion modeling in planning for potential pollutant effects and determining safety measures for affected populations, especially in urban settings.
By understanding these concepts, we can better monitor air quality and make informed decisions regarding industrial sites and pollution management.
Youtube Videos


Audio Book
Dive deep into the subject with an immersive audiobook experience.
Overview of SO Emission Estimation
Chapter 1 of 6
🔒 Unlock Audio Chapter
Sign up and enroll to access the full audio experience
Chapter Content
So we want to look at SO emission from a stack. So this is what we want, estimate SO concentration at ground level center line 50 and 500 meters from the stack.
Detailed Explanation
The section starts by explaining the goal of estimating sulfur dioxide (SO2) emissions from a stack. It specifically mentions two distances from the stack: 50 meters and 500 meters. Understanding how to calculate the concentration of pollutants like SO2 at various distances is crucial in environmental engineering, as it helps assess air quality and the potential impact on communities.
Examples & Analogies
Imagine a factory that emits smoke from a tall chimney. We need to check how much smoke is reaching people living nearby. By measuring the smoke concentration at different distances from the chimney, we can determine if the air is safe to breathe or if improvements are needed.
Parameters for Calculation
Chapter 2 of 6
🔒 Unlock Audio Chapter
Sign up and enroll to access the full audio experience
Chapter Content
the height of the stack is 60 meters; it is already given to you. Q, that is given to you is 160 gram per second. From the overcast conditions, we can select the stability class from the Pascal differs table...
Detailed Explanation
For the emissions estimation, specific parameters are crucial. The height of the stack (60 meters) is significant as it influences how far emissions rise before dispersing. The emission rate (Q = 160 grams per second) quantifies how much SO2 is released. Weather conditions categorized as overcast help us determine the stability class, which affects how pollutants disperse in the atmosphere. It's essential to understand these parameters to calculate pollutant concentrations accurately.
Examples & Analogies
Think about baking a cake. You need specific ingredients like flour (height of the stack) and sugar (emission rate) to get the right flavor. Similarly, environmental scientists need precise data about the stack height and emission rate to accurately predict SO2 concentrations in the air.
Stability Class and Its Importance
Chapter 3 of 6
🔒 Unlock Audio Chapter
Sign up and enroll to access the full audio experience
Chapter Content
Now, this is a matter of judgment...this is an estimate not the true value because a lot of other factors that will Gaussian dispersion model...
Detailed Explanation
The stability class helps determine how pollutants disperse in the air. Different classes indicate varying weather conditions, which influence wind patterns and how pollutants spread. Factors like temperature inversions can lead to different pollution levels. The Gaussian dispersion model provides a simplified view of how pollutants behave in ideal conditions, but real-life scenarios often involve complexities not accounted for by the model.
Examples & Analogies
Imagine a candle (the stack) in a room with different venting systems (stability classes). If the windows are open (class D), the smoke will disperse quickly, but if they are closed (class A), the smoke lingers. Understanding these classes is crucial for predicting smoke behavior reliably.
Calculating Concentration at Specific Points
Chapter 4 of 6
🔒 Unlock Audio Chapter
Sign up and enroll to access the full audio experience
Chapter Content
So we are looking at x equals 500...I get a value of 66 microgram meter cube of SO2.
Detailed Explanation
To determine the concentration of SO2 at particular locations (like 500 meters downwind), calculations based on the dispersion model are performed. The value obtained gives a measure of pollution that can help in assessing health risks for the community. In this case, the result of 66 micrograms per cubic meter indicates the environmental impact of the stack’s emissions.
Examples & Analogies
If you are standing 500 meters away from a barbecue grill (the stack), you might smell the smoke (SO2). The stronger the smell, the higher the concentration. We calculate exact values to see if the pollution from the grill is too much for anyone nearby.
Crosswind Calculation Considerations
Chapter 5 of 6
🔒 Unlock Audio Chapter
Sign up and enroll to access the full audio experience
Chapter Content
Second example; so here we set 50 meters crosswind, which means that y is not 0 anymore...
Detailed Explanation
In the second scenario, the focus is on measuring concentration at a crosswind distance (50 meters away from the central line). This means that we're assessing the effects of pollution not just directly downwind, but rather at different angles relative to the wind direction. This added complexity ensures a comprehensive understanding of pollution dispersion patterns.
Examples & Analogies
Like checking how far a smell from a bakery travels as you walk by it (crosswind versus straight downwind). By smelling bread at various points along your walk (50 meters off the center), you get a better understanding of how pervasive the bakery's smell is within the area.
Application of the Gaussian Dispersion Model
Chapter 6 of 6
🔒 Unlock Audio Chapter
Sign up and enroll to access the full audio experience
Chapter Content
So how do we apply this dispersion model...? estimate the concentration of pollutants at all receptors.
Detailed Explanation
The Gaussian dispersion model is used extensively to predict how pollutants released from one or several sources affect air quality. By defining measurement points (receptors), scientists can map out the affected areas and concentrations of pollutants. This helps in assessing environmental impacts and implementing necessary action plans.
Examples & Analogies
It's like creating a map showing how far the smell of a fish market (the sources) travels in the city. By knowing where people live and the wind's direction, you can predict who might smell the fish and plan interventions if required.
Key Concepts
-
Gaussian Dispersion Model: A mathematical model used to estimate the concentration of pollutants in the atmosphere based on emissions from a point source (the stack) considering distance from the source, atmospheric stability, and other factors.
-
Emission Parameters: The relevant parameters needed for the computation, such as the emission rate (Q), stack height (H), and stability classes (e.g., class D for slightly unstable conditions).
-
Calculations: Detailed steps for performing calculations to determine concentration at a ground level, factoring in different coordinates (crosswind and downwind) for comprehensive assessments.
-
Superposition of Sources: The methodology for assessing multiple emissions sources and their collective impact on air quality by adding up contributions from each source.
-
Mapping and Contour Representation: The importance of visualizing pollutant concentrations using contour maps (isopleths) to guide emergency response and urban planning decisions. The region around a pollution source can be mapped to identify areas at risk based on emission rates and meteorological conditions.
-
Emergency Response Planning: Practical applications of dispersion modeling in planning for potential pollutant effects and determining safety measures for affected populations, especially in urban settings.
-
By understanding these concepts, we can better monitor air quality and make informed decisions regarding industrial sites and pollution management.
Examples & Applications
Estimating SO₂ concentration at 500 meters from a stack given an emission rate of 160 grams/second and a stack height of 60 meters.
Mapping pollutant dispersion from multiple sources, contributing to a cumulative concentration at specific receptor locations around an industrial area.
Memory Aids
Interactive tools to help you remember key concepts
Rhymes
When sulfur's in the air from a stack so high, / Count on dispersion to spread it wide. / With Q for rate and H for height, / We calculate concentration, keep the air clean and right.
Stories
Once in a city, there was a factory that released SO₂. Curious about how far it traveled, the town held a contest to map its spread using the Gaussian model. The children learned that higher stacks helped the smoke disperse farther away, keeping their hometown safe.
Memory Tools
Remember ‘S.O.C’ for sulfur (S), the emission rate (O for 160 g/s), and the Concentration (C) calculations — it’s all about balancing these!
Acronyms
‘C.S.E’ — Concentration, Stack height, and Emission rate are the three keys we use for dispersion calculations.
Flash Cards
Glossary
- Gaussian Dispersion Model
A mathematical representation used for predicting the concentration of pollutants emitted from a point source into the atmospheric environment.
- SO₂ Emission
The release of sulfur dioxide gas, typically from industrial processes or combustion of fossil fuels.
- Stability Class
Classification of the atmosphere based on atmospheric stability, which affects pollutant dispersion and dilution.
- Contouring or Isopleth Mapping
A method for visualizing the spatial distribution of pollutants, connecting points of equal concentration on a map.
- Stack Height
The height of the stack from which emissions are released; it influences the dispersion of pollutants in the atmosphere.
- Emission Rate (Q)
The quantity of a pollutant that is emitted from a source per unit time, often measured in grams per second.
Reference links
Supplementary resources to enhance your learning experience.