
Estimation of Infiltration Indices from Hydrographs
Enroll to start learning
You’ve not yet enrolled in this course. Please enroll for free to listen to audio lessons, classroom podcasts and take practice test.
Interactive Audio Lesson
Listen to a student-teacher conversation explaining the topic in a relatable way.
Introduction to Hydrographs
🔒 Unlock Audio Lesson
Sign up and enroll to listen to this audio lesson

Today, we are going to discuss how we can use hydrographs to estimate infiltration indices. Can anyone tell me what a hydrograph represents?

Isn't it just a graph that shows river discharge over time?
Exactly! A hydrograph shows how the discharge of water in a river changes over time, particularly after a rainfall event. This helps us in analyzing the storm runoff. Now, what do you think we need to estimate an infiltration index from this data?

We need to know the total rainfall and the direct runoff?
Perfect! We plot the rainfall hyetograph and the runoff hydrograph together. This lets us visually compare them. What do we do next after plotting?

We estimate the total rainfall and direct runoff, right?
Exactly! And what's the key element we might need to estimate next?

Initial losses, like water that doesn't actually infiltrate?
You got it! Once we have all of these pieces, we can plug the values into our formulas for φ and W indices. Let’s summarize: we plot the graphs, estimate rainfall and runoff, account for initial losses, and then use formulas. Great discussion!
Calculating Initial Losses
🔒 Unlock Audio Lesson
Sign up and enroll to listen to this audio lesson

Now let’s delve deeper into estimating initial losses. Why do you think this step is important?
Because they reduce the amount of water that can actually infiltrate into the soil?
Very true! Initial losses can include interception and surface storage. Can anyone provide examples of what counts as 'initial losses'?
Like when raindrops are caught on leaves or puddles form on the ground?
Exactly! These losses can significantly alter our calculations. If we ignore them, what might happen?
We could think there's more runoff than there actually is, right?
Spot on! So, once we estimate these initial losses, what is our next step in the process?
We plug those values into the φ or W-index formulas to get our index?
Correct! Excellent understanding of how estimation works in this context.
Applying the Infiltration Indices
🔒 Unlock Audio Lesson
Sign up and enroll to listen to this audio lesson
Let’s discuss how we apply the infiltration indices derived from hydrographs. Why do we want to estimate these indices?
To manage stormwater better and predict floods?
Yes! Estimating these indices helps engineers design better flood control systems. Can anyone think of scenarios where these estimates would be vital?
In urban planning to ensure drainage systems can handle runoff?
Exactly! And what about agricultural settings?
They help in determining how much irrigation would be needed based on infiltration?
You've all hit the nail on the head! By estimating infiltration indices, we can manage water resources much more efficiently. So to summarize, these indices play crucial roles in urban drainage design, flood forecasting, and irrigation planning.
Introduction & Overview
Read summaries of the section's main ideas at different levels of detail.
Quick Overview
Standard
The section outlines a systematic approach for deriving infiltration indices based on actual rainfall-runoff data, emphasizing the importance of plotting hyetographs and hydrographs and the necessary calculations involved.
Detailed
Estimation of Infiltration Indices from Hydrographs
To derive infiltration indices like the φ-index or W-index from actual rainfall-runoff data, the following systematic steps are taken:
- Plotting: A rainfall hyetograph and the corresponding runoff hydrograph are plotted to visualize the data effectively.
- Estimation of Total Rainfall (P): The total volume of rainfall during the storm event is estimated from the hyetograph.
- Estimation of Direct Runoff (Q): Total runoff volume is computed using the area under the runoff hydrograph.
- Initial Losses: If applicable, initial losses which may include precipitation interception and surface retention need to be estimated.
- Substitution in Formula: Finally, the derived values of rainfall (P), runoff (Q), and initial losses are substituted into the appropriate index formula (φ-index or W-index) to yield the infiltration index.
This process is crucial as it allows for the effective analysis of storm runoff events, which is vital in hydrological studies and engineering applications.
Youtube Videos
![WRE Module2 [PART02]- Infiltration indices: phi-index and w-index, runoff by infiltration method](https://img.youtube.com/vi/TS6Mem4j-qY/mqdefault.jpg)


Audio Book
Dive deep into the subject with an immersive audiobook experience.
Plotting Rainfall and Runoff Data
Chapter 1 of 5
🔒 Unlock Audio Chapter
Sign up and enroll to access the full audio experience
Chapter Content
- Rainfall Hyetograph and Runoff Hydrograph are plotted.
Detailed Explanation
The first step in estimating infiltration indices from hydrographs involves creating two important graphical representations: the Rainfall Hyetograph and the Runoff Hydrograph. The Rainfall Hyetograph shows the amount of rainfall (precipitation) over time, while the Runoff Hydrograph illustrates the surface runoff generated from that rainfall over the same period. By plotting these two graphs, we can visually analyze the relationship between rainfall and subsequent runoff, which is crucial for understanding infiltration dynamics.
Examples & Analogies
Imagine you're observing a sponge submerged in water. The Rainfall Hyetograph represents the waves of water hitting the sponge over time, while the Runoff Hydrograph represents the amount of water flowing out from the sponge. By comparing these two graphs, you can see how well the sponge absorbs water (infiltration) versus how much water drips off (runoff).
Estimating Rainfall and Runoff
Chapter 2 of 5
🔒 Unlock Audio Chapter
Sign up and enroll to access the full audio experience
Chapter Content
- Total rainfall (P) and direct runoff (Q) are estimated.
Detailed Explanation
Once the graphs are plotted, we need to quantitatively estimate the total rainfall (P) that occurred during the storm and the amount of direct runoff (Q) that was generated as a result. This estimation often involves calculating the area under the Rainfall Hyetograph to determine total rainfall and the area under the Runoff Hydrograph to find total runoff. Accurate estimates of these values are essential because they form the fundamental input for calculating infiltration indices.
Examples & Analogies
Think of a container collecting rainwater. By measuring how much rainwater is collected (P) and how much spills out over the rim (Q), you gain insight into how much water the container could hold versus how much is escaping. This provides a clear picture of the rainfall's effect on the container.
Computing Total Runoff Volume
Chapter 3 of 5
🔒 Unlock Audio Chapter
Sign up and enroll to access the full audio experience
Chapter Content
- Using area under the hydrograph, total runoff volume is computed.
Detailed Explanation
The next step involves using the plotted Runoff Hydrograph to compute the total runoff volume. This is done by calculating the area under the runoff curve during the period of interest. The area can typically be calculated using methods such as trapezoidal rule or numerical integration. The total runoff volume is a key quantity as it helps us understand how much of the rainfall ends up as surface runoff rather than infiltrating into the soil.
Examples & Analogies
Consider a water slide. As water flows down the slide, some splashes out and collects in a pool (runoff). To find out how much water is in the pool, you would measure the area of the splash zone below the slide over time—you’re essentially computing the total runoff.
Estimating Initial Losses
Chapter 4 of 5
🔒 Unlock Audio Chapter
Sign up and enroll to access the full audio experience
Chapter Content
- Initial losses are estimated (if required).
Detailed Explanation
In some cases, before calculating the infiltration indices, it's necessary to estimate initial losses. Initial losses refer to the water that does not immediately contribute to runoff but is lost due to factors like evaporation, interception by trees, or surface storage in depressions. Quantifying these losses helps refine the runoff measurements and leads to more accurate estimates of infiltration indices.
Examples & Analogies
Think of a sponge again. Before the sponge can absorb water, some of the water simply sits on its surface, or some might even evaporate. Just like measuring the water that is lost before absorption helps determine the sponge's efficiency, estimating initial losses enables more accurate infiltration calculations.
Substituting Values in Index Formulas
Chapter 5 of 5
🔒 Unlock Audio Chapter
Sign up and enroll to access the full audio experience
Chapter Content
- Substituting values in the φ or W-index formula yields the index.
Detailed Explanation
The final step in estimating infiltration indices involves substituting the calculated values of total rainfall (P), total runoff (Q), and any estimated initial losses into the relevant formulas for the chosen infiltration index—either the φ-index or the W-index. This calculation allows hydrologists to estimate the average infiltration capacity and further analyze how well the catchment responds to rainfall events.
Examples & Analogies
Imagine baking a cake; to find out how much flour you need, you would input the various ingredients (like water, eggs, and butter). Similarly, substituting the rainfall and runoff data into the formulas gives you a precise measure of how much water the soil can actually absorb, akin to the final product of your cake.
Key Concepts
-
Infiltration Capacity: The maximum rate at which soil can absorb water at any given time.
-
Effective Rainfall: The rainfall volume that contributes to runoff after accounting for initial losses.
-
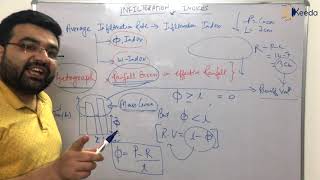
φ-index: The average infiltration rate that equates observed direct runoff to rainfall excess.
-
W-index: A modified φ-index that accounts for initial losses before the infiltration begins.
Examples & Applications
An urban area experiences a rainfall of 50 mm for 3 hours, with a measured direct runoff of 30 mm. Using these figures, one would plot the hyetograph and hydrograph, estimate total rainfall and runoff, and calculate appropriate indices.
In a catchment with heavy interception due to foliage, initial losses may be estimated at 10 mm, indicating a need to adjust runoff calculations to account for the absorbed rainfall.
Memory Aids
Interactive tools to help you remember key concepts
Rhymes
Hydrograph shows flow, rain above, runoff below, estimate well, and watch the water go!
Stories
Once in a land where rain fell heavily, a wise engineer plotted the rain and rivers, carefully noting who lost what to the trees and ground before the water flowed away.
Memory Tools
To remember the steps for calculating indices: Plot, Estimate, Account, Substitute - PEAS for 'Infiltration Indices'.
Acronyms
P.R.E.S. - Plot, Rainfall and Runoff estimate, Estimate losses, Substitute for indices.
Flash Cards
Glossary
- Infiltration Indices
Empirical tools representing average infiltration characteristics of a storm event or catchment area.
- Hydrograph
A graph showing the rate of flow (discharge) versus time at a specific location in a river.
- Hyetograph
A graphical representation of the distribution of rainfall over time.
- Initial Losses
The amount of precipitation lost through interception and surface storage before infiltration begins.
- Rainfall Excess
The rainfall volume that contributes to runoff, after accounting for initial losses.
Reference links
Supplementary resources to enhance your learning experience.