
Fundamental relations of traffic flow - 31
Enroll to start learning
You’ve not yet enrolled in this course. Please enroll for free to listen to audio lessons, classroom podcasts and take practice test.
Interactive Audio Lesson
Listen to a student-teacher conversation explaining the topic in a relatable way.
Introduction to Time Mean Speed and Space Mean Speed
🔒 Unlock Audio Lesson
Sign up and enroll to listen to this audio lesson

Today, we will explore two critical concepts in traffic flow analysis: Time Mean Speed and Space Mean Speed. Can anyone tell me what speed means in the context of traffic?

Speed is how fast the vehicles are moving.
Correct! Now, Time Mean Speed, or TMS, is the average speed of vehicles over time. It's essentially a simple average of spot speeds at a particular location. Who can guess the formula for Time Mean Speed?

Isn't it the sum of spot speeds divided by the number of observations?
Excellent! The formula is \( v_t = \frac{\sum v_i}{n} \). Let's transition to Space Mean Speed... What do you think that involves?

Maybe averaging speed based on space instead of time?
That's correct! Space Mean Speed is the harmonic mean of the spot speeds. Who can remember why we use harmonic mean?

Because it gives more weight to slower speeds?
Exactly! Let's recap: TMS gives an overall average of speeds over time, while SMS accounts for distances traveled by slower vehicles.
Relationships Between Speed Metrics
🔒 Unlock Audio Lesson
Sign up and enroll to listen to this audio lesson

Now that we've established what each speed metric is, let's dive into their relationship. Can anyone explain how TMS and SMS relate?
I think TMS is always greater than SMS because TMS includes all speeds?
Well stated! Specifically, TMS weighs all vehicles equally, while SMS gives more importance to slower speeds since they are on the road longer. Can someone compute an example using both speeds?
Sure! If we have spot speeds of 50, 40, and 60... TMS would be…
…TMS is 50! And for SMS, using the harmonic mean...
Great calculations! Remember, SMS < TMS in essence captures the efficiency of traffic flow.
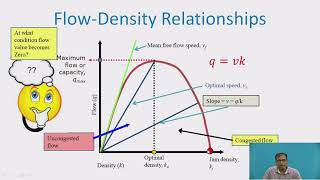
Fundamental Diagrams of Traffic Flow
🔒 Unlock Audio Lesson
Sign up and enroll to listen to this audio lesson
Let’s discuss the fundamental diagrams of traffic flow. Who can explain what the flow-density diagram looks like?
It likely starts at zero-flow and zero-density and curves up as density increases?
Exactly! This curve typically reaches a maximum flow before dropping to zero when density peaks. Now, can someone describe what happens at maximum density?
At jam density, vehicles cannot move, so the flow is zero!
Correct! Understanding this diagram helps us visualize traffic behavior. Can anyone explain how speed relates to flow and density?
As density increases, speed decreases until maximum density is reached, right?
Well summarized! We've covered the foundational aspects of traffic flow relationships today!
Examples and Applications
🔒 Unlock Audio Lesson
Sign up and enroll to listen to this audio lesson
Let's reinforce our learning with some practical examples. If I state the speeds of 50, 40, 60, 54, and 45, can anyone quickly calculate TMS and SMS?
TMS will come out to 49.8, and SMS will be around 48.82!
Impressive! Now, what if we have a frequency table of varying speeds? How would we proceed?
We find the average speed for each range and multiply it by the frequency to calculate total volume, right?
Absolutely correct! This is a practical approach that reflects real-world traffic assessments.
Final Recap and Importance
🔒 Unlock Audio Lesson
Sign up and enroll to listen to this audio lesson
Before we wrap up, why do you think understanding these traffic flow concepts is critical?
It helps in traffic management and optimizing flow efficiency!
And planning for infrastructure improvements!
Exactly! Whether for urban planning or regulations, these metrics provide valuable insight into our traffic systems.
Introduction & Overview
Read summaries of the section's main ideas at different levels of detail.
Quick Overview
Standard
The section delves into the definitions and calculations of time mean speed and space mean speed, demonstrating their relationship and relevance in traffic flow analysis. It further introduces key traffic flow parameters and graphical representations.
Detailed
Detailed Summary
Overview
This section lays out the fundamental concepts surrounding traffic flow, primarily focusing on speed metrics: time mean speed and space mean speed.
Time Mean Speed (TMS)
- Defined as the average speed of vehicles passing a point over time.
- The formula for calculating TMS is:
.
Where:
- \( v_t \) = time mean speed
- \( n \) = number of observations
- \( v_i \) = spot speed of the ith vehicle
Space Mean Speed (SMS)
- It provides a different perspective, averaging speeds over space rather than time.
- Calculated by:
.
Where:
- \( v_s \) = space mean speed
- Derived as the harmonic mean of spot speeds.
Examples
Two illustrative examples are provided, showcasing how to calculate both mean speeds from given spot speeds and frequency tables.
Relationship and Diagrams
- The section ends with a discussion on the relationships between traffic variables such as flow, density, and speed, represented graphically in fundamental diagrams.
- It emphasizes that space mean speed is always less than or equal to time mean speed due to the weights assigned: slower vehicles contribute more heavily in SMS calculations.
Through this, the section lays the groundwork for understanding how traffic flow can be quantified and represented both numerically and visually, providing crucial insights for traffic engineering.
Youtube Videos

![Speed / Density / Flow Relationships | NCEES Civil Engineering PE Exam [Section 5.1.1.4; 5.1.2]](https://img.youtube.com/vi/DmrmtYLabrI/mqdefault.jpg)
Audio Book
Dive deep into the subject with an immersive audiobook experience.
Overview of Traffic Flow Parameters
Chapter 1 of 5
🔒 Unlock Audio Chapter
Sign up and enroll to access the full audio experience
Chapter Content
Speed is one of the basic parameters of traffic flow and time mean speed and space mean speed are the two representations of speed. Time mean speed and space mean speed and the relationship between them will be discussed in detail in this chapter. The relationship between the fundamental parameters of traffic flow will also be derived. In addition, this relationship can be represented in graphical form resulting in the fundamental diagrams of traffic flow.
Detailed Explanation
This chunk introduces us to two crucial concepts in traffic flow analysis: time mean speed and space mean speed. Time mean speed refers to the average speed of vehicles at a specific location over a set duration, whereas space mean speed takes into account the variations in speed across a specific stretch of road. The chapter also indicates that these concepts will be illustrated graphically, helping us visualize how they relate to each other and the fundamental parameters of traffic flow such as volume and density.
Examples & Analogies
Imagine a group of runners on a track. Time mean speed is akin to measuring how fast each runner completes a lap over a set period, while space mean speed can be thought of as looking at the average speed of every runner at any given time along the track. Hence, understanding both speeds provides a fuller picture of the runners' performance.
Time Mean Speed
Chapter 2 of 5
🔒 Unlock Audio Chapter
Sign up and enroll to access the full audio experience
Chapter Content
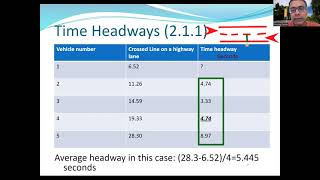
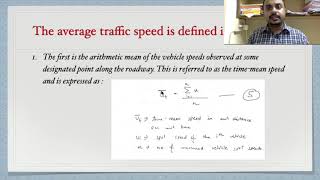
As noted earlier, time mean speed is the average of all vehicles passing a point over a duration of time. It is the simple average of spot speed. Time mean speed v is given by,
v = \frac{1}{n} \sum_{i=1}^{n} v_{i}, (31.1)
where v is the spot speed of ith vehicle, and n is the number of observations.
Detailed Explanation
In this section, we learn how to calculate time mean speed, which is simply an average of the speeds of all vehicles passing a given point during a specified timeframe. The formula provided helps us compute this average using the speeds of individual vehicles (spot speeds) and the total number of vehicles observed. This gives us a clear understanding of the average speed as experienced by vehicles on the road over that time span.
Examples & Analogies
Consider a classroom where five students take a test one after the other. If their test scores are 80, 90, 70, 85, and 95, the time mean speed would be comparable to the average score of all students, calculated simply by adding all scores and dividing by the number of students. This average gives us an overall view of the students’ performance in that particular test duration.
Space Mean Speed
Chapter 3 of 5
🔒 Unlock Audio Chapter
Sign up and enroll to access the full audio experience
Chapter Content
The space mean speed also averages the spot speed, but spatial weightage is given instead of temporal. This is derived as below. Consider unit length of a road, and let v_{i} be the spot speed of ith vehicle. Let t be the time the vehicle takes to complete unit distance and is given by 1/v_{i}. Therefore from the above equation, average travel time t_s is given by,
t_s = \frac{1}{n} \sum_{i=1}^{n} \frac{1}{v_{i}}. (31.3)
Detailed Explanation
Space mean speed is different from time mean speed in that it considers the time each vehicle takes to travel a certain distance, effectively weighing speeds according to how long vehicles are on the road. This gives a more realistic view when analyzing traffic flow, particularly because slower vehicles influence the overall traffic conditions more than faster ones. The formula provided calculates the average travel time for vehicles, which can then be inverted to obtain the space mean speed.
Examples & Analogies
Think of a parade where some floats move slowly while others go fast. The space mean speed focuses on how long each float takes to cover a distance. If a float crawls at 5 mph while another zooms at 50 mph, the overall pace of the parade will reflect the slower float’s performance much more than the fast one, similar to how space mean speed highlights the effect of slower vehicles in traffic.
Relation between Time Mean Speed and Space Mean Speed
Chapter 4 of 5
🔒 Unlock Audio Chapter
Sign up and enroll to access the full audio experience
Chapter Content
The relation between time mean speed and space mean speed can be derived as below. ... Therefore, time mean speed will always be greater than space mean speed since standard deviation cannot be negative.
Detailed Explanation
This section derives the relationship between time mean speed and space mean speed mathematically. It shows that the time mean speed is always greater than or equal to the space mean speed because of the standard deviation involved in the calculations. The intuition behind this is that if all vehicles travel at the same speed, then both measures would be equal. However, in real-world traffic, there are usually variations in speeds, leading to a higher time mean speed.
Examples & Analogies
Imagine a group of friends driving toward a concert. If one friend is stuck in traffic while the others are cruising along, the average speed of the group (time mean speed) will be higher than the speed at which they would all travel if they stuck together (space mean speed). The slower friend effectively brings down the overall 'group speed' when considering space, while the others accelerate the average when time is counted.
Fundamental Relations of Traffic Flow
Chapter 5 of 5
🔒 Unlock Audio Chapter
Sign up and enroll to access the full audio experience
Chapter Content
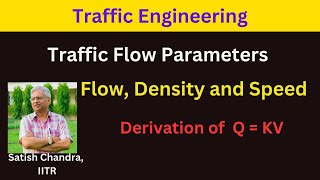
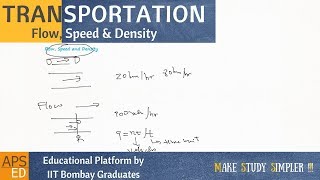
The relationship between the fundamental variables of traffic flow, namely speed, volume, and density, is called the fundamental relations of traffic flow... This is the fundamental equation of traffic flow. Please note that, v in the above equation refers to the space mean speed.
Detailed Explanation
This section encapsulates the core principles of traffic flow, linking speed, volume, and density into a fundamental equation. It establishes that the flow of traffic (how many vehicles pass a point in a given time) is directly related to the density of vehicles on the road and their average speed over a distance. This equation serves as a critical tool for understanding and analyzing traffic patterns and behaviors.
Examples & Analogies
Think of a water pipe. The flow of water through the pipe can be compared to traffic flow: if the pipe is narrow (high density), the water's movement will be slower (lower speed), while a wider pipe (lower density) allows water to flow quickly (higher speed). Just as the dimensions of the pipe affect water flow, road conditions and density dictate how smoothly traffic moves.
Key Concepts
-
Time Mean Speed: The average speed of vehicles over a set time interval.
-
Space Mean Speed: The average speed of vehicles over a distance, accounting for time taken by each vehicle.
-
Relationship of TMS and SMS: TMS is generally greater than or equal to SMS.
-
Fundamental Traffic Flow Variables: The primary relationships between flow, density, and speed.
Examples & Applications
Two illustrative examples are provided, showcasing how to calculate both mean speeds from given spot speeds and frequency tables.
Relationship and Diagrams
The section ends with a discussion on the relationships between traffic variables such as flow, density, and speed, represented graphically in fundamental diagrams.
It emphasizes that space mean speed is always less than or equal to time mean speed due to the weights assigned: slower vehicles contribute more heavily in SMS calculations.
Through this, the section lays the groundwork for understanding how traffic flow can be quantified and represented both numerically and visually, providing crucial insights for traffic engineering.
Memory Aids
Interactive tools to help you remember key concepts
Rhymes
Time means time, Space means place; Measure wisely, keep up the pace!
Stories
Imagine a race where cars take different routes. Time Mean Speed counts all cars over the clock, while Space Mean Speed weighs each car's path, favoring those slower on a long road!
Memory Tools
TMS = Time, SMS = Slow Minutes Slope: Remember, slower vehicles take longer on the road!
Acronyms
TMS = Time, SMS = Space; Think 'T for Time, S for Space'.
Flash Cards
Glossary
- Time Mean Speed
The average speed of vehicles passing a point over a specific time duration.
- Space Mean Speed
The average speed accounting for the spatial distribution of vehicles over a road segment.
- Harmonic Mean
A type of average that is more appropriate for rates and speeds.
- Density
The number of vehicles per unit length of a road.
- Flow
The number of vehicles passing a point over a specified period.
Reference links
Supplementary resources to enhance your learning experience.