
JVM Monitoring and Profiling Tools
Enroll to start learning
You’ve not yet enrolled in this course. Please enroll for free to listen to audio lessons, classroom podcasts and take practice test.
Interactive Audio Lesson
Listen to a student-teacher conversation explaining the topic in a relatable way.
Introduction to JVM Monitoring Tools
🔒 Unlock Audio Lesson
Sign up and enroll to listen to this audio lesson

Today, we will explore various JVM monitoring tools. Can anyone tell me why monitoring is important for Java applications?

Because it helps us understand how our application is performing, right?
Exactly! Monitoring can reveal performance bottlenecks and memory leaks. One of the command-line tools we can use is jstat. Who can guess what jstat does?

Isn't that for monitoring JVM statistics?
Correct! jstat provides runtime statistics on memory usage, garbage collection, and other Java VM metrics. Remember, J. S. T. A. T. — it gives you the Stats!
Command-Line Monitoring Tools
🔒 Unlock Audio Lesson
Sign up and enroll to listen to this audio lesson

Let's talk more about command-line tools. Besides jstat, we have jmap and jstack. Who can tell me what jmap is used for?

Isn't it for generating memory heap dumps?
Exactly! jmap is essential for dumping memory and analyzing heap usage. It's an important tool for finding memory leaks. What about jstack?

That shows thread stack traces, right?
Spot on! jstack gives you insight into what threads are doing at any given time. Let’s remember: 'J. M. A. P. — Memory Analysis Pro,' and 'J. S. T. A. C. K. — Stack Traceable Knowledge.'
GUI Monitoring Tools
🔒 Unlock Audio Lesson
Sign up and enroll to listen to this audio lesson
Now, moving on to GUI monitoring tools. Has anyone used VisualVM or JConsole?
I've seen VisualVM. It looks really user-friendly!
Yes! VisualVM allows you to monitor memory consumption and thread activity graphically. It's great for real-time profiling and performance analysis. JConsole is a lighter option for memory and CPU monitoring. Keep in mind: 'VisualVM Visually Monitors,' helping your graphical mapping of JVM performance!
Advanced Profiling with JMC
🔒 Unlock Audio Lesson
Sign up and enroll to listen to this audio lesson
Let's focus on advanced profiling with Java Mission Control. How does JMC aid in JVM performance?
It integrates with Java Flight Recorder, right? So, it gives deep insights during execution.
Absolutely! JMC captures detailed profiling data for analysis. It's beneficial for long-term performance tuning. Remember the acronym JMC: 'Java Monitoring Companion.' It truly complements your performance journey!
Introduction & Overview
Read summaries of the section's main ideas at different levels of detail.
Quick Overview
Standard
In this section, we discuss a range of tools for JVM monitoring and profiling, covering both command-line and GUI options. These tools, such as jstat, VisualVM, and Java Mission Control, provide valuable insights into memory usage, thread activity, and garbage collection, assisting developers in optimizing application performance.
Detailed
JVM Monitoring and Profiling Tools
Understanding the performance of Java applications is crucial for developers. JVM Monitoring and Profiling Tools allow developers to gain insights into various aspects of application performance, helping identify bottlenecks and optimize resource usage. This section introduces command-line tools like jstat, jmap, jstack, and jcmd that provide statistics on heap memory, threads, and garbage collection.
Additionally, it covers GUI-based tools such as VisualVM, JConsole, and Java Mission Control (JMC) that offer interactive interfaces for monitoring JVM performance. JMC, in particular, works in tandem with Java Flight Recorder (JFR) for comprehensive profiling, enabling developers to deep-dive into performance metrics and behaviors.
Utilizing these tools effectively can lead to improved application performance, reduced latency, and heightened throughput.
Youtube Videos

Audio Book
Dive deep into the subject with an immersive audiobook experience.
Command-Line Tools
Chapter 1 of 2
🔒 Unlock Audio Chapter
Sign up and enroll to access the full audio experience
Chapter Content
- jstat: JVM statistics monitoring tool.
- jmap: Dumps memory maps and heap info.
- jstack: Shows thread stack traces.
- jcmd: Sends diagnostic commands.
Detailed Explanation
This chunk discusses various command-line tools used for monitoring and profiling the Java Virtual Machine (JVM). Each tool has a specific function:
- jstat: This tool allows you to monitor JVM statistics in real-time. It can provide information about garbage collection statistics, memory usage, and other performance metrics.
- jmap: This tool creates memory maps and provides information about the heap used by the JVM. It can be used to understand memory usage and to dump heap information for analysis.
- jstack: This command displays the current stack traces of Java threads running in the JVM. This is useful for diagnosing threading issues, such as deadlocks or performance bottlenecks.
- jcmd: This tool can send diagnostic commands to the JVM, allowing you to perform various administrative tasks like triggering garbage collection or obtaining thread information.
Examples & Analogies
Imagine a car's dashboard that displays various metrics such as speed, fuel level, and engine health. The command-line tools operate like this dashboard, providing live feedback on the JVM's performance and health, allowing developers to make informed decisions about their application's performance.
GUI Tools
Chapter 2 of 2
🔒 Unlock Audio Chapter
Sign up and enroll to access the full audio experience
Chapter Content
- VisualVM: Visual tool for memory and thread profiling.
- JConsole: Lightweight monitoring of memory and CPU.
- Java Mission Control (JMC): Works with Java Flight Recorder (JFR) for deep profiling.
Detailed Explanation
This chunk outlines graphical user interface (GUI) tools available for JVM monitoring and profiling. Each tool transforms complex data into an easy-to-analyze format through visual representation:
- VisualVM: This tool combines several monitoring, troubleshooting, and profiling capabilities into a single interface. It provides visual insights into memory usage, CPU performance, and thread activity, making it easier to diagnose issues.
- JConsole: A simple yet effective tool for monitoring the performance of a Java application. It provides real-time data about memory consumption, CPU usage, and thread activity, helping developers visually inspect how their application performs.
- Java Mission Control (JMC): This tool analyzes the performance of Java applications while minimizing overhead. It works in conjunction with Java Flight Recorder (JFR) to provide deep profiling capabilities, allowing developers to investigate detailed application metrics and tuning opportunities.
Examples & Analogies
Think of GUI tools like a high-tech cockpit in an airplane, where pilots can easily see the status of all the critical components of the aircraft. Similarly, these GUI tools present complex JVM metrics in a user-friendly manner, allowing developers to navigate through performance data with ease.
Key Concepts
-
JVM Monitoring: The process of using tools to track performance, memory usage, and other metrics of Java applications.
-
Command-Line Tools: Tools like jstat, jmap, and jstack that provide insights through the terminal.
-
GUI Tools: User-friendly tools like VisualVM and JConsole that offer graphical views of JVM performance.
-
Java Mission Control: An advanced profiling tool that integrates with Java Flight Recorder for deep performance analysis.
Examples & Applications
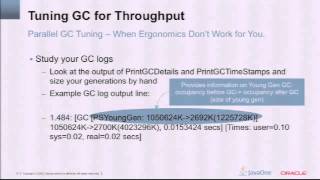
Using jstat to monitor garbage collection activity: jstat -gcutil <pid> shows the utilization of different memory spaces in the heap.
VisualVM allows you to visualize CPU and memory metrics over time, helping identify memory leaks.
Java Mission Control can be used to analyze data collected from Java Flight Recorder to pinpoint performance bottlenecks.
Memory Aids
Interactive tools to help you remember key concepts
Rhymes
For JVM stats, just take a look! With jstat, you can read the book.
Stories
Imagine a detective called VisualVM, equipped with tools to solve performance mysteries in Java apps.
Memory Tools
Remember 'J.M.C.' as 'Java Monitoring Companion' to simplify your profiling journey.
Acronyms
J.S.T.A.T. - 'Java Stats
Tracking All Threads and usage.'
Flash Cards
Glossary
- jstat
A command-line tool that monitors JVM statistics such as memory usage, garbage collection metrics, and more.
- jmap
A command-line tool that allows you to generate memory heap dumps and view memory maps.
- jstack
A command-line tool that shows Java thread stack traces, helping to identify thread states and issues.
- JConsole
A GUI tool for monitoring Java applications that provides real-time information on memory and CPU usage.
- VisualVM
A visual tool for monitoring and profiling Java applications, allowing detailed analysis of CPU and memory.
- Java Mission Control (JMC)
A profiling and diagnostics tool that works with Java Flight Recorder for in-depth performance analysis of Java applications.
Reference links
Supplementary resources to enhance your learning experience.