
Frequency Response of CE and CS Amplifiers (Part C)
Enroll to start learning
You’ve not yet enrolled in this course. Please enroll for free to listen to audio lessons, classroom podcasts and take practice test.
Interactive Audio Lesson
Listen to a student-teacher conversation explaining the topic in a relatable way.
Introduction to Amplifiers and Frequency Response
🔒 Unlock Audio Lesson
Sign up and enroll to listen to this audio lesson

Welcome everyone! Today, we’ll explore how we can analyze the frequency response of amplifiers, specifically focusing on Common Emitter (CE) and Common Source (CS) amplifiers. To begin, who can explain what we mean by 'frequency response'?

Is it how the amplifier behaves with different input frequencies?
Exactly! The frequency response shows us how gain changes with frequency. Let’s dive deeper into the circuits we’ll study. Can anyone recall the types of circuits we would analyze for this?

C-R and R-C circuits?
Good! These circuits help us understand how the capacitors and resistors contribute to the amplifier's behavior across frequencies.
Small-Signal Equivalent Circuits
🔒 Unlock Audio Lesson
Sign up and enroll to listen to this audio lesson

Now, let’s take a look at the small-signal equivalent circuit of our CE amplifier. With your understanding of R and C circuits, how do you think we model this?

We replace the transistor with a voltage dependent current source?
Exactly! This model simplifies our analysis. Understanding the dependence on parameters like transconductance is crucial. What is transconductance, can anyone explain?

It’s the ratio of output current to input voltage, right?
Spot on! This relationship can help us determine the output voltage across our load in the circuit.
Determining Gain and Cutoff Frequency
🔒 Unlock Audio Lesson
Sign up and enroll to listen to this audio lesson
Now that we have the small-signal model, we can determine the gain of the amplifier. Can anyone tell me how the gain is generally represented?
It’s usually given as a product of transconductance and load resistance?
Correct! It’s defined as -g × R. Moving on to cutoff frequency—what affects the lower cutoff frequency in our feedback circuit?
The capacitor value and the resistance at the input?
Yes, the cutoff frequency can be found using these parameters. It’s essential! Remember the acronym 'GCR' for Gain-Cutoff Relationship!
Phase Response and Bode Plots
🔒 Unlock Audio Lesson
Sign up and enroll to listen to this audio lesson
Let’s move to Bode plots! Who can explain why understanding phase response is important?
It helps in anticipating how the amplifier will respond over a range of frequencies.
Right! The phase change can indicate system stability. Our plot will show how gain and phase vary. Can someone identify what happens around cutoff frequencies?
The gain decreases, and the phase usually shifts significantly?
Excellent! It’s this understanding which leads to effective amplifier design.
Recap and Summary
🔒 Unlock Audio Lesson
Sign up and enroll to listen to this audio lesson
Let's recap! Today, we discussed the frequency response of CE and CS amplifiers, the significance of small-signal models, and how to determine gain and phase response through practical applications. Who can summarize what we've learned about cutoff frequencies?
The lower cutoff is determined by C and input resistance, while the upper cutoff is related to R and the load capacitance.
Perfect summary! Remember these relationships as they are key to understanding amplifier design. See you in our next class!
Introduction & Overview
Read summaries of the section's main ideas at different levels of detail.
Quick Overview
Standard
In this section, we analyze how the frequency response of CE and CS amplifiers can be determined using C-R and R-C circuits. Key parameters such as gain and cutoff frequency are derived, showcasing the significance of the amplifier model to understand its frequency behavior.
Detailed
Detailed Summary
This section focuses on the frequency response of Common Emitter (CE) and Common Source (CS) amplifiers. It begins by discussing the generalized form of a network comprising C-R and R-C circuits, which serve as the foundation for understanding the frequency responses of these amplifiers. The section elaborates on the small-signal equivalent circuits for both the CE and CS amplifiers, detailing how signals are conditioned through capacitors and resistors.
It specifically emphasizes how input and output impedances affect the cutoff frequencies, explaining that the entire amplifier can be modeled with equivalent resistances and capacitances. The teacher provides insight into the characteristics of the frequency response, including the gain plot and phase plot, allowing students to visualize how these parameters change with frequency.
Towards the conclusion, the significance of the frequency response in practical applications is underscored, emphasizing how these foundational concepts tie into more complex amplifier designs.
Youtube Videos

Audio Book
Dive deep into the subject with an immersive audiobook experience.
Introduction to Frequency Response
Chapter 1 of 6
🔒 Unlock Audio Chapter
Sign up and enroll to access the full audio experience
Chapter Content
So, welcome back after the short break. And we are talking about Frequency Response of the Amplifier and we have seen that generalized form of a network consists of C-R circuit and R-C circuit and in between we do have an amplifier.
Detailed Explanation
In this chunk, we reintroduce the main topic, which is the frequency response of amplifiers. We discuss that amplifiers can be modeled using a combination of resistors and capacitors, specifically in C-R (capacitor-resistor) and R-C (resistor-capacitor) configurations. Understanding these circuits is fundamental for analyzing how amplifiers behave at various frequencies.
Examples & Analogies
Think of an amplifier like a water faucet where the flow of water represents signal flow. The C-R and R-C circuits act like valves that control how quickly water can flow through the faucet at different pressure levels, similar to how frequency response affects signal amplitude.
Common Source Amplifier Setup
Chapter 2 of 6
🔒 Unlock Audio Chapter
Sign up and enroll to access the full audio experience
Chapter Content
So, say to start with we do have common source amplifier and the circuit is given here. The circuit is given here for your reference and if you see here we do have the main part main amplifier here and then, we are feeding the signal through this capacitor called say C.
Detailed Explanation
Here, we specifically focus on a common source amplifier configuration, which is a type of transistor amplifier. The signal is introduced through a coupling capacitor (C), which allows AC signals to pass while blocking DC. This setup is crucial for ensuring that the circuit functions correctly in terms of signal amplification.
Examples & Analogies
Imagine the capacitor as a gate that only opens during a party (when there's an AC signal). It prevents the daily mundane activities (DC signals) from entering the party, ensuring only the fun (the AC signal) impacts the atmosphere (the amplifier circuit).
Small Signal Equivalent Circuit
Chapter 3 of 6
🔒 Unlock Audio Chapter
Sign up and enroll to access the full audio experience
Chapter Content
If we draw the small signal equivalent circuit after obtaining the quiescent point and other things are defined by R , R ; then, V and then R .
Detailed Explanation
In this part, we discuss the concept of a small signal equivalent circuit. This is a simplified version of the actual amplifier circuit that is used for analyzing small variations in signals around a DC operating point, called the quiescent point. The resistors (R1, R2) and the output voltage are crucial for modeling how the amplifier will behave with small input signals.
Examples & Analogies
Think of the small signal equivalent circuit like zooming in on a small part of a busy city street to get a better understanding of how a car behaves in traffic when the overall traffic condition is stable. It allows us to analyze how slight changes in traffic (input signals) affect the flow of cars (output signals).
Voltage-Dependent Current Source
Chapter 4 of 6
🔒 Unlock Audio Chapter
Sign up and enroll to access the full audio experience
Chapter Content
Where V it is V node, it is AC ground and the transistor it is getting replaced by its small signal model which is voltage dependent current source called i. Its expression it is given by transconductance g × v.
Detailed Explanation
This chunk explains the key element in the small signal model: the voltage-dependent current source. This current source, represented as 'i', is driven by the transconductance (g) and the voltage across the gate-source junction (vg). This relation helps us understand how input signal variations convert to current variations, leading to output voltage changes.
Examples & Analogies
Visualize this situation as a water pump where the voltage (vg) acts as the pressure input. As you increase the pressure (voltage), more water (current) flows out, demonstrating how amplifiers convert input signals into larger output signals through a controlled mechanism.
Thevenin Equivalent Circuit
Chapter 5 of 6
🔒 Unlock Audio Chapter
Sign up and enroll to access the full audio experience
Chapter Content
This part the output port part, it can be translated into Thevenin equivalent, namely we can make the amplifier which is having a gain of ‒ g × R.
Detailed Explanation
Here, we introduce the concept of the Thevenin equivalent circuit, which simplifies complex circuits to a single voltage source and series resistance. This concept is critical as it allows us to analyze the amplifier's behavior with ease, focusing on the gain and how input signals translate into output signals.
Examples & Analogies
Imagine converting a complicated recipe with multiple ingredients into a simpler one that focuses only on the main ingredient. The Thevenin equivalent simplifies the circuit, so we can easily see how the main component (the amplifier) affects the outcome (the output signal) without getting lost in complexities.
Frequency Response Summary
Chapter 6 of 6
🔒 Unlock Audio Chapter
Sign up and enroll to access the full audio experience
Chapter Content
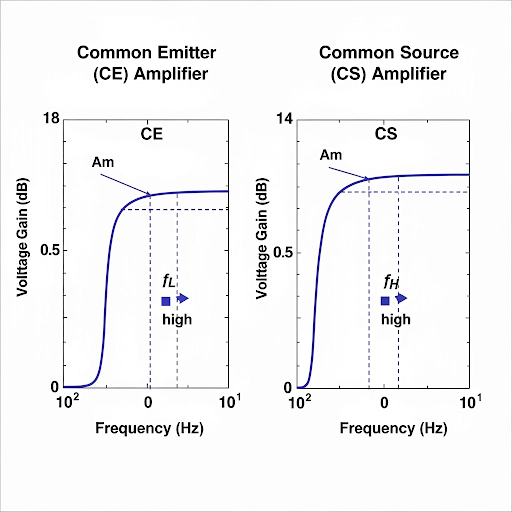
So, as we have said that the frequency response now if you are asked to draw the frequency response or the bode plot particularly the gain plot, I think you will be able to do it yourself.
Detailed Explanation
In this concluding part, we summarize how to analyze the frequency response of the amplifier. The Bode plot represents gain and phase shift over a range of frequencies. Through this analysis, students gain insight into how parameters like capacitance and resistance influence the amplifier's performance at various frequencies.
Examples & Analogies
This is like creating a roadmap of how best to drive through various terrains. The gain and phase response give you a clear picture of the most efficient paths (frequencies) to enhance your travel experience (amplifier output) at different points along your journey.
Key Concepts
-
Frequency Response: The response of an amplifier to differing input frequencies, illustrated through gain and phase plots.
-
Gain: The ratio of output voltage to input voltage, determining the amplification factor in the circuit.
-
Transconductance (g): A crucial parameter that depicts the sensitivity of the output current in response to changes in input voltage.
Examples & Applications
The relationship between gain and transconductance can be illustrated by an amplifier circuit where a higher transconductance yields a greater output voltage.
In graphical form, a Bode plot can demonstrate how an amplifier's gain changes at different frequencies, highlighting the cutoff points.
Memory Aids
Interactive tools to help you remember key concepts
Rhymes
Capacitance high, frequency low, in the circuits, that’s how they flow.
Stories
Imagine a concert where different instruments play at various frequencies. The amplifiers adjust their output to ensure every note hits just right, illustrating how frequency response operates to balance each sound.
Memory Tools
GCR - Gain, Cutoff, Response. Remember this for understanding frequency relationships in amplifiers.
Acronyms
FRA - Frequency Response Analysis, which helps to recall that we'll analyze the frequency effects on signal response.
Flash Cards
Glossary
- Frequency Response
The behavior of an amplifier in response to different input frequencies, typically represented in a Bode plot.
- Common Emitter Amplifier (CE)
A type of amplifier configuration that inverts the input signal and provides high gain.
- Common Source Amplifier (CS)
Amplifier configuration often used in FETs, providing similar characteristics to the CE amplifier.
- Transconductance
The ratio of output current to input voltage in a transistor amplifier.
- Bode Plot
A graph that shows the frequency response of a system, plotting gain and phase against frequency on a logarithmic scale.
- Cutoff Frequency
The frequency at which the output power drops to half its maximum value, marking the boundary between different frequency bands.
Reference links
Supplementary resources to enhance your learning experience.