
Market Equilibrium
Enroll to start learning
You’ve not yet enrolled in this course. Please enroll for free to listen to audio lessons, classroom podcasts and take practice test.
Interactive Audio Lesson
Listen to a student-teacher conversation explaining the topic in a relatable way.
Understanding Market Equilibrium
🔒 Unlock Audio Lesson
Sign up and enroll to listen to this audio lesson

Today, we're diving into market equilibrium! Who can tell me what happens at equilibrium in a market?

Isn't that where the amount bought equals the amount sold?
Exactly! It’s the point where quantity demanded equals quantity supplied at a specific price. Let's remember that with the acronym 'Equal Supply and Demand' or ESD. Can someone explain what happens if this balance is upset?

If demand is greater than supply, there’s 'excess demand.'
Right! And what about the opposite scenario?

That would be 'excess supply' when supply exceeds demand!
Correct! Let’s summarize today’s key points: market equilibrium is where supply meets demand (p*)) and we can have excess demand or excess supply when things go off balance.
Shifts in Demand and Supply
🔒 Unlock Audio Lesson
Sign up and enroll to listen to this audio lesson

Now, let's discuss shifts in the demand and supply curves. When demand increases, what happens to the equilibrium?
The equilibrium price goes up!
Great! And how about the quantity supplied?

That also increases because more consumers want the product!
Exactly! If there’s a decrease in supply, what do you expect to happen?
Prices will go higher and the quantity supplied will drop.
Correct! We can think of demand shifts driving up quantities and prices, while supply shifts do the opposite. Keep that in mind as we continue to explore these concepts.
Practical Applications of Market Equilibrium
🔒 Unlock Audio Lesson
Sign up and enroll to listen to this audio lesson
Let's apply our knowledge to real-world examples. How do you think a government price ceiling affects equilibrium?
If the ceiling is set below equilibrium, it creates excess demand!
Exactly! It can lead to shortages. And what about a price floor?
That can cause excess supply if it's above the equilibrium price.
Very good! In summary, government interventions like price ceilings and floors can disrupt equilibrium and cause market distortions.
Introduction & Overview
Read summaries of the section's main ideas at different levels of detail.
Quick Overview
Standard
Market equilibrium occurs when the plans of consumers and firms align, with the market supply equaling market demand at a specific equilibrium price and quantity. This section further discusses how shifts in demand and supply affect market equilibrium, leading to excess supply or excess demand.
Detailed
Market Equilibrium
Market equilibrium is a critical concept in economics, marking the point where the quantity of a commodity demanded by consumers equals the quantity supplied by firms. This balance is represented graphically by the intersection of the demand and supply curves at a specific price level, known as the equilibrium price (p) and quantity (q). In a perfectly competitive market, when there is a discord between supply and demand, it leads to either excess demand (when demand exceeds supply, pushing prices up) or excess supply (when supply exceeds demand, pushing prices down). Both scenarios eventually lead to market adjustments due to the 'Invisible Hand,' described by Adam Smith, guiding the market back to equilibrium.
This section elaborates on circumstances under which equilibrium is achieved and explored how shifts in demand (due to consumer preferences or income changes) and supply (due to changes in production costs) can affect the equilibrium. Concepts of excess demand and excess supply are framed in terms of necessary adjustments in market behavior, showcasing the dynamic nature of market equilibrium within the economic landscape.
Youtube Videos


Audio Book
Dive deep into the subject with an immersive audiobook experience.
Introduction to Market Equilibrium
Chapter 1 of 5
🔒 Unlock Audio Chapter
Sign up and enroll to access the full audio experience
Chapter Content
This chapter will be built on the foundation laid down in Chapters 1, 2 and 4 where we studied the consumer and firm behaviour when they are price takers. In Chapter 2, we have seen that an individual’s demand curve for a commodity tells us what quantity a consumer is willing to buy at different prices when he takes price as given. The market demand curve in turn tells us how much of the commodity all the consumers taken together are willing to purchase at different prices when everyone takes price as given. In Chapter 4, we have seen that an individual firm’s supply curve tells us the quantity of the commodity that a profit-maximising firm would wish to sell at different prices when it takes price as given and the market supply curve tells us how much of the commodity all the firms taken together would wish to supply at different prices when each firm takes price as given. In this chapter, we combine both consumers’ and firms’ behaviour to study market equilibrium through demand-supply analysis and determine at what price equilibrium will be attained. We also examine the effects of demand and supply shifts on equilibrium. At the end of the chapter, we will look at some of the applications of demand-supply analysis.
Detailed Explanation
This introductory paragraph sets the context for understanding market equilibrium by linking it to prior chapters on consumer and firm behavior. It emphasizes how individual demand and supply contribute to the broader market dynamics. Market equilibrium occurs when the quantity demanded equals the quantity supplied, which dictates the price at which goods are sold.
Examples & Analogies
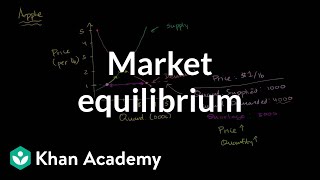
Consider a busy marketplace where stall owners (firms) and buyers (consumers) interact. Each buyer wants to buy a certain amount of a product, and each stall owner has a certain amount of the product to sell. When the price is right, the number of buyers who want to purchase the product matches the number of products available, similar to how in equilibrium the quantities match.
Definition of Equilibrium
Chapter 2 of 5
🔒 Unlock Audio Chapter
Sign up and enroll to access the full audio experience
Chapter Content
An equilibrium is defined as a situation where the plans of all consumers and firms in the market match and the market clears. In equilibrium, the aggregate quantity that all firms wish to sell equals the quantity that all the consumers in the market wish to buy; in other words, market supply equals market demand. The price at which equilibrium is reached is called equilibrium price and the quantity bought and sold at this price is called equilibrium quantity. Therefore, (p, q) is an equilibrium if qD(p∗) = qS(p∗).
Detailed Explanation
Equilibrium is the state where market supply equals market demand, meaning that every seller can sell as much as they want at the market price, and every buyer can buy as much as they want as well. The equilibrium price (p) is the price at which this balance is achieved, and the equilibrium quantity (q) is the number of goods bought and sold at this price. This situation leads to a stable market condition, avoiding excess supply or demand.
Examples & Analogies
Imagine a seesaw: when both sides have equal weight, the seesaw stays balanced. Similarly, in a market, when the amount consumers wish to purchase equals what producers have available, the market is balanced (in equilibrium), just like the seesaw.
Excess Demand and Excess Supply
Chapter 3 of 5
🔒 Unlock Audio Chapter
Sign up and enroll to access the full audio experience
Chapter Content
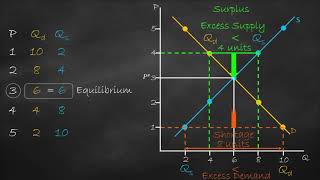
If at a price, market supply is greater than market demand, we say that there is an excess supply in the market at that price and if market demand exceeds market supply at a price, it is said that excess demand exists in the market at that price. Therefore, equilibrium in a perfectly competitive market can be defined alternatively as zero excess demand-zero excess supply situation. Whenever market supply is not equal to market demand, and hence the market is not in equilibrium, there will be a tendency for the price to change.
Detailed Explanation
Excess demand occurs when the amount consumers want to buy exceeds what producers are willing or able to supply at a certain price. Conversely, excess supply happens when producers have more of a good available than what consumers want to buy. In both scenarios, prices will adjust: if there's excess demand, prices usually rise; if there's excess supply, prices typically fall until equilibrium is restored.
Examples & Analogies
Think of a concert: if more fans want tickets than there are available, the demand drives prices up because people are willing to pay more. On the other hand, if too many tickets are sold and few fans show up, the price may drop for future concerts to ensure that the venue sells out.
Market Dynamics: The Invisible Hand
Chapter 4 of 5
🔒 Unlock Audio Chapter
Sign up and enroll to access the full audio experience
Chapter Content
From the time of Adam Smith (1723-1790), it has been maintained that in a perfectly competitive market an ‘Invisible Hand’ is at play which changes price whenever there is imbalance in the market. Our intuition also tells us that this ‘Invisible Hand’ should raise the prices in case of ‘excess demand’ and lower the prices in case of ‘excess supply’. Throughout our analysis we shall maintain that the ‘Invisible Hand’ plays this very important role. Moreover, we shall take it that the ‘Invisible Hand’ by following this process is able to reach the equilibrium.
Detailed Explanation
The concept of the ‘Invisible Hand’ suggests that individual self-interest in a competitive market inadvertently leads to beneficial outcomes for the economy as a whole. When excess demand causes prices to rise, it signals producers to increase supply. Similarly, when there’s excess supply and prices fall, it can encourage consumers to buy more. This self-regulating nature helps guide the market toward equilibrium naturally over time without the need for central planning.
Examples & Analogies
Imagine you’re in a market with a variety of fruits. If strawberries are in short supply, their price goes up, encouraging more farmers to grow strawberries. Conversely, if there’s too many strawberries produced and they start to rot, their price might drop, leading consumers to buy more. In both cases, the market adjusts without anyone telling farmers what to do, showcasing the power of the 'Invisible Hand.'
Market Equilibrium with Fixed Number of Firms
Chapter 5 of 5
🔒 Unlock Audio Chapter
Sign up and enroll to access the full audio experience
Chapter Content
Recall that in Chapter 2 we have derived the market demand curve for price-taking consumers, and for price-taking firms the market supply curve was derived in Chapter 4 under the assumption of a fixed number of firms. In this section with the help of these two curves we will look at how supply and demand forces work together to determine where the market will be in equilibrium when the number of firms is fixed. We will also study how the equilibrium price and quantity change due to shifts in demand and supply curves.
Detailed Explanation
This section emphasizes how market demand and supply curves help identify equilibrium conditions in a market where the number of firms remains constant. The intersection of the demand and supply curves indicates the equilibrium point. Furthermore, shifts in these curves can change the equilibrium price and quantity; for example, increased demand shifts the demand curve right, potentially increasing both the equilibrium price and quantity.
Examples & Analogies
Imagine a small bakery (fixed number of firms) that experiences a sudden increase in cupcake demand because of a local event. The bakery’s owners would respond by increasing prices to maximize profits and potentially bake more, which demonstrates how demand shifts can impact market pricing even when the number of sellers remains unchanged.
Key Concepts
-
Market Equilibrium: The point where supply equals demand.
-
Excess Demand: When demand exceeds supply, leading to potential shortages.
-
Excess Supply: When supply exceeds demand, leading to potential surpluses.
-
Demand Curve: Illustrates how quantity demanded varies with price.
-
Supply Curve: Illustrates how quantity supplied varies with price.
Examples & Applications
An increase in consumer income leads to a rightward shift in the demand curve for normal goods, increasing both price and quantity at equilibrium.
A decrease in the number of suppliers in the market can shift the supply curve leftward, increasing the equilibrium price and decreasing the quantity.
Memory Aids
Interactive tools to help you remember key concepts
Rhymes
In the market fair, where all is set, supply and demand meet without a fret.
Stories
Imagine a town where everyone wants apples. If too many apple sellers open shop, prices drop until supply meets demand, restoring balance.
Memory Tools
Remember 'PEE' for Price-Equilibrium-Excess demand/supply.
Acronyms
ESD - Excess Supply Demand depicts market layers.
Flash Cards
Glossary
- Equilibrium Price
The price at which the quantity supplied and quantity demanded are equal.
- Excess Demand
A situation where demand for a good exceeds its supply at a given price.
- Excess Supply
A situation where supply of a good exceeds its demand at a given price.
- Demand Curve
A graph showing the relationship between the price of a good and the quantity demanded.
- Supply Curve
A graph showing the relationship between the price of a good and the quantity supplied.
Reference links
Supplementary resources to enhance your learning experience.