
Market Equilibrium: Fixed Number of Firms
Enroll to start learning
You’ve not yet enrolled in this course. Please enroll for free to listen to audio lessons, classroom podcasts and take practice test.
Interactive Audio Lesson
Listen to a student-teacher conversation explaining the topic in a relatable way.
Understanding Market Equilibrium
🔒 Unlock Audio Lesson
Sign up and enroll to listen to this audio lesson

Today, we are going to discuss market equilibrium. Can anyone tell me what market equilibrium means?

Isn't it when the quantity demanded equals the quantity supplied?
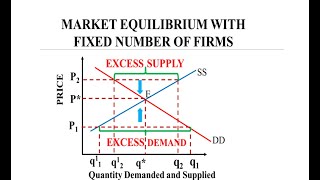
Exactly! That's the essence of market equilibrium. It occurs at a price where the plans of all consumers and firms match, often denoted as (p*, q*).

What happens if there's excess supply or demand?
Great question! Excess supply occurs when quantity supplied exceeds quantity demanded, leading to downward pressure on prices. Conversely, excess demand occurs when demand exceeds supply, pushing prices up. Let's remember it as 'Supply Up, Price Down; Demand Up, Price Up'!

So, is price always adjusted to reach equilibrium?
Yes! This adjustment happens due to the 'Invisible Hand' that drives the market to balance itself. We'll delve deeper into how this works in our examples.
Summing up, market equilibrium is where demand meets supply, creating stability in the market. Now, let's move on to how supply and demand curves are derived.
Demand and Supply Curves
🔒 Unlock Audio Lesson
Sign up and enroll to listen to this audio lesson

Now let's discuss the demand and supply curves. Can anyone remind me what the demand curve represents?

It shows how much of a good consumers will buy at various prices, right?
Exactly! And the supply curve shows how much firms are willing to sell. In a fixed-number of firms scenario, both are crucial for determining equilibrium.
How do shifts in these curves affect the equilibrium?
If demand shifts to the right, we can see that at the existing price, we have excess demand, which means prices will rise until a new equilibrium is reached. It’s important to visualize this shift. Remember our phrase 'Shift Right, Price Up'!
So, if supply shifts to the left, what would happen?
Exactly! 'Shift Left, Price Up' again. These shifts affect equilibrium price and quantity significantly. Remembering these phrases will help reinforce these relationships.
To conclude, equilibrium is dynamically adjusted during shifts in demand and supply curves, and understanding these shifts is critical in economics.
Examples of Market Equilibrium
🔒 Unlock Audio Lesson
Sign up and enroll to listen to this audio lesson
Let’s apply what we’ve learned with an example from the wheat market. Can someone summarize the equations for demand and supply?
The demand is given by qD = 200 – p and supply by qS = 120 + p.
Exactly! Now, to find equilibrium, we set qD equal to qS. What do we get?
After solving, we get p* = 40!
Right! And at this price, what is the equilibrium quantity?
It’s q* = 160 kg.
Perfect! This example illustrates how the demand and supply equations help determine market equilibrium clearly. These calculations are fundamental!
In summary, we've seen how theoretical concepts apply directly to real markets. Keep practicing with more examples for better retention!
Introduction & Overview
Read summaries of the section's main ideas at different levels of detail.
Quick Overview
Standard
In this section, we explore how the fixed number of firms influences market equilibrium in perfectly competitive markets. By analyzing demand and supply curves, we examine conditions of excess supply and demand, and how shifts in these curves affect the equilibrium price and quantity.
Detailed
Detailed Summary
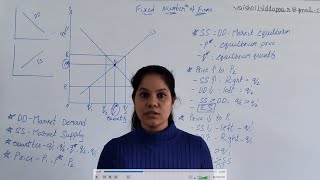
In a perfectly competitive market, the equilibrium is achieved when the market demand equals market supply. This section builds on concepts discussed in previous chapters, particularly focusing on how consumer behavior impacts market demand and firm behavior affects market supply. An equilibrium is characterized by a balance where the aggregate quantity of goods that consumers wish to purchase matches the quantity that firms wish to sell, leading to an equilibrium price (p) and quantity (q). If market supply exceeds demand, excess supply occurs, while excess demand arises when demand exceeds supply. The section emphasizes the role of the 'Invisible Hand' in driving prices towards equilibrium in cases of excess supply or demand. Additionally, shifts in demand and supply curves are analyzed to understand the implications for equilibrium price and quantity. Several examples and graphs illustrate these concepts, including a detailed example concerning the wheat market.
Youtube Videos


Audio Book
Dive deep into the subject with an immersive audiobook experience.
Market Demand and Supply Curves
Chapter 1 of 5
🔒 Unlock Audio Chapter
Sign up and enroll to access the full audio experience
Chapter Content
Recall that in Chapter 2 we have derived the market demand curve for price-taking consumers, and for price-taking firms the market supply curve was derived in Chapter 4 under the assumption of a fixed number of firms. In this section with the help of these two curves we will look at how supply and demand forces work together to determine where the market will be in equilibrium when the number of firms is fixed.
Detailed Explanation
This segment highlights the importance of market demand and supply curves which were established in previous chapters. The market demand curve represents how much consumers are willing to buy at different prices, while the market supply curve indicates how much producers are willing to sell. In equilibrium, these two curves interact to establish the market price and quantity when the number of firms remains constant.
Examples & Analogies
Think of a marketplace where vendors (firms) sell apples (the product). If there are 10 vendors selling apples at $1 each (market price), the total amount of apples supplied is determined by these vendors' willingness to sell at that price. Similarly, consumers have their preferences which dictate how many apples they buy at that price.
Defining Market Equilibrium
Chapter 2 of 5
🔒 Unlock Audio Chapter
Sign up and enroll to access the full audio experience
Chapter Content
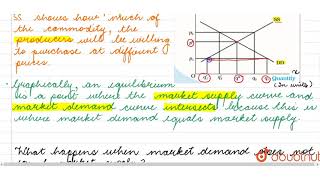
An equilibrium is defined as a situation where the plans of all consumers and firms in the market match and the market clears. In equilibrium, the aggregate quantity that all firms wish to sell equals the quantity that all the consumers in the market wish to buy; in other words, market supply equals market demand.
Detailed Explanation
Market equilibrium occurs when the quantity of goods that consumers want to purchase at a specific price is equal to the quantity of goods that firms are willing to sell. This creates a balance, meaning there is neither a surplus nor a shortage of goods in the market. The equilibrium situation is vital because it ensures that resources are allocated efficiently.
Examples & Analogies
Imagine a concert where 100 tickets are sold for a price of $50 each. If 100 fans want to buy tickets, the market is at equilibrium because the number of tickets meets the demand. However, if 150 fans want tickets at that price, there will be excess demand leading to potential price increases.
Equilibrium Price and Quantity
Chapter 3 of 5
🔒 Unlock Audio Chapter
Sign up and enroll to access the full audio experience
Chapter Content
The price at which equilibrium is reached is called equilibrium price and the quantity bought and sold at this price is called equilibrium quantity. Therefore, (p, q) is an equilibrium if qD(p) = qS(p).
Detailed Explanation
The equilibrium price (p) is the price at which the quantity demanded (qD) equals the quantity supplied (qS). The equilibrium quantity (q) is the amount of goods sold and bought at that price. When prices are higher than p*, there is excess supply, and when prices are lower, there is excess demand, pushing the price back to equilibrium.
Examples & Analogies
If a villa in a desirable neighborhood is priced at $500,000, and at that price, 10 buyers are willing to buy it (demand) while 8 sellers are willing to sell it (supply), a shortage occurs. As eager buyers compete for the villa, the price might rise to $525,000, where supply equals demand, achieving equilibrium.
Impact of Excess Demand and Supply
Chapter 4 of 5
🔒 Unlock Audio Chapter
Sign up and enroll to access the full audio experience
Chapter Content
If at a price, market supply is greater than market demand, we say that there is an excess supply in the market at that price and if market demand exceeds market supply at a price, it is said that excess demand exists in the market at that price.
Detailed Explanation
Excess supply occurs when the quantity of goods supplied exceeds the quantity demanded, leading to unsold products and price cuts. Conversely, excess demand happens when consumers want more goods than what is being supplied, causing prices to rise until a new equilibrium is reached. Understanding these dynamics helps firms adjust their strategies.
Examples & Analogies
Consider a bakery that has baked 200 loaves of bread, but only 150 customers show up to buy them at $3 per loaf. This situation leads to excess supply. To clear out the remaining loaves, the bakery might have to lower the price to $2.50, or they risk wasting the bread, reflecting how excess supply drives price adjustments.
Adjustments towards Equilibrium
Chapter 5 of 5
🔒 Unlock Audio Chapter
Sign up and enroll to access the full audio experience
Chapter Content
Whenever market supply is not equal to market demand, and hence the market is not in equilibrium, there will be a tendency for the price to change. ... This assumption will be taken to hold in all that we discuss in the text.
Detailed Explanation
When the market is out of equilibrium, either through excess demand or excess supply, prices adjust. For excess demand, prices tend to rise as consumers compete for limited goods. In the case of excess supply, sellers might reduce prices to entice more buyers. This constant dance of price change is crucial for achieving and maintaining equilibrium.
Examples & Analogies
Think about a popular movie that has only a few screenings left. If ticket demand skyrockets, the theater might raise ticket prices to maximize profit, thereby adjusting to new equilibrium. Conversely, if ticket sales are slow when prices are high, they will lower prices to attract more viewers, restoring equilibrium.
Key Concepts
-
Market Equilibrium: Occurs when supply meets demand.
-
Equilibrium Price and Quantity: Price and quantity at which market clears.
-
Excess Demand: Leads to upward pressure on prices.
-
Excess Supply: Results in a decrease in prices.
Examples & Applications
Example of the Wheat Market: Demand (qD = 200 - p) and Supply (qS = 120 + p) lead to equilibrium price of Rs. 40 and quantity of 160 kg.
Impact of Shift in Demand: If demand increases, prices rise until a new equilibrium is achieved.
Memory Aids
Interactive tools to help you remember key concepts
Rhymes
When supply meets demand, prices stand; excess up makes prices go high, while low demand lets prices fly.
Stories
Once in a market, two friends argued over price: one wanted to sell high, the other wanted to buy low. As they discussed, they found a common price, where both were happy—this was their market equilibrium.
Memory Tools
Remember 'ED' for Excess Demand and 'ES' for Excess Supply. ED means Price Up, ES means Price Down.
Acronyms
EQUIP
for Equilibrium
for Quantity
for Unchanged Price with Balance
for Invisible Hand
for Price Adjustments.
Flash Cards
Glossary
- Market Equilibrium
A condition in which quantity demanded equals quantity supplied at the prevailing market price.
- Excess Demand
A situation where the quantity demanded exceeds the quantity supplied at a given price.
- Excess Supply
A condition that occurs when quantity supplied exceeds quantity demanded at a given price.
- Equilibrium Price
The price at which the quantity of goods supplied equals the quantity of goods demanded.
- Equilibrium Quantity
The quantity of goods bought and sold at the equilibrium price.
Reference links
Supplementary resources to enhance your learning experience.