
Project Network Diagram
Enroll to start learning
You’ve not yet enrolled in this course. Please enroll for free to listen to audio lessons, classroom podcasts and take practice test.
Interactive Audio Lesson
Listen to a student-teacher conversation explaining the topic in a relatable way.
Understanding Project Network Diagrams
🔒 Unlock Audio Lesson
Sign up and enroll to listen to this audio lesson

Today we're going to discuss project network diagrams. Can anyone tell me what a project network diagram represents?

Is it like a flowchart for the different activities in a project?
Exactly! It visually shows all the project activities from start to finish. Each activity is represented along with important metrics like the duration and various time constraints—what do we call those?

Those would be the earliest start time and latest start time, right?
Correct! The earliest start time indicates when an activity can begin without delay. What happens if we need to delay an activity? Any ideas?

I think there’s something called float that shows how much we can delay it?
Well done! Float measures the flexibility we have in delaying an activity without affecting the project’s overall completion.

So if an activity has a float of 3 days, it means we can delay it by that much?
Exactly! So now let's summarize: the network diagram shows activities, their durations, and how they can be scheduled within the project timeline. Understanding these metrics is crucial for effective project management.
Resource Allocation under Constraints
🔒 Unlock Audio Lesson
Sign up and enroll to listen to this audio lesson

Moving on, what about when we face resource constraints? How does that impact our network diagram?
I guess we have to rethink how we allocate resources since they aren't unlimited.
Right! We need to consider how many cranes or resources are available. Let's say we only have two cranes for our activities; what would we do?
We would have to prioritize which activities get the cranes based on their urgency?
Exactly! This is where the least total float approach comes into play. Can anyone explain what this approach is?
It means we assign resources to activities that have a lower float first since those are more critical!
Exactly, Student_3! The least total float method helps us allocate resources wisely to ensure the project stays on track. Let's summarize: we address resource constraints by prioritizing activities with less float to minimize delays.
Critical Path and Project Completion
🔒 Unlock Audio Lesson
Sign up and enroll to listen to this audio lesson
Now, who can tell me about the critical path in a project?
Isn’t it the longest path that decides the minimum completion time for the project?
Correct! For this project, which activities are part of the critical path?
Activities B, E, and I are critical because if any of them delay, the project completion will be affected.
Exactly! And what is the initial projected completion time we considered without resource constraints?
It was 20 days!
Great! But once we apply resource constraints, what is the new completion time we end up with?
It went up to 29 days.
Yes, resource constraints typically extend the project duration. The takeaway from today’s lesson: managing the critical path and float can greatly influence project timelines.
Introduction & Overview
Read summaries of the section's main ideas at different levels of detail.
Quick Overview
Standard
In this section, we delve into project network diagrams, emphasizing the importance of scheduling activities based on their duration, earliest and latest start and finish times, and calculating float. We also explore resource allocation under constraints, highlighting critical paths and the least total float approach for effective project management.
Detailed
Project Network Diagram
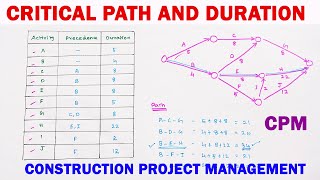
This section covers the critical elements of creating and understanding a project network diagram, which visually represents the activities involved in a project and their interdependencies. Each activity from A to K is defined with its corresponding duration, along with critical time metrics: earliest start time, earliest finish time, latest start time, and latest finish time. The earliest start time indicates the soonest at which an activity can begin, while the latest start time denotes the maximum delay possible without impacting the project's overall completion. The difference between these two times is described as the float of the activity, which indicates how much delay can be accommodated.
In scenarios where resources are initially assumed to be unlimited, the project can be planned with a completion time of 20 days. However, in real-world applications, resource constraints like the limited number of cranes available can significantly affect this timeline. The critical path—made up of activities B, E, and I—determines the longest duration and is key to project scheduling and resource management. ... The method of least total float is introduced for resource allocation, where resources are prioritized for critical activities based on their float or latest start times.
Overall, this section emphasizes project scheduling's complexities and the need for careful resource management to minimize delays.
Youtube Videos


Audio Book
Dive deep into the subject with an immersive audiobook experience.
Understanding the Project Network Diagram
Chapter 1 of 7
🔒 Unlock Audio Chapter
Sign up and enroll to access the full audio experience
Chapter Content
So, this slide shows the project network diagram of a particular project with activities from A to K. The activity duration is represented here as you can see A refers to the activity and 8 refers to the activity duration.
Detailed Explanation
A project network diagram visually represents the sequence of activities in a project, showing how they relate to each other. In this diagram, we see activities labeled from A to K, where each letter represents a task or activity. The number associated with each activity, like '8' for activity A, indicates the duration it will take to complete that task. This visual format helps project managers see the overall flow of the project and how tasks are interconnected.
Examples & Analogies
Think of it like a map for a road trip. Each activity represents a stop along the route, and the duration is the time you spend at each stop. Just as you wouldn't want to miss a turn on the map, in project management, it's essential to follow the network accurately to keep the project on track.
Earliest and Latest Start Times
Chapter 2 of 7
🔒 Unlock Audio Chapter
Sign up and enroll to access the full audio experience
Chapter Content
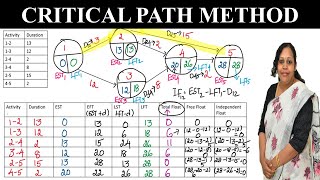
Above the arrow in the diagram, the numbers indicate the earliest start and earliest finish times. Below the arrow, the numbers indicate the latest start and latest finish times.
Detailed Explanation
The earliest start time is the soonest a task can begin without delay, while the latest start time is the last possible time it can start without affecting the overall completion of the project. Understanding these times is crucial for planning and ensuring the project stays on schedule. For example, if an activity can be delayed by three days without impacting the project finish date, it has a float of three days.
Examples & Analogies
Imagine planning a family event where certain tasks must be done by certain deadlines. The earliest you can send out invites (earliest start time) is crucial, as is the latest you can send them without risking the attendance of guests (latest start time). Just like in planning this event, project managers must identify these times to maintain a smooth project flow.
Project Constraints and Completion Time
Chapter 3 of 7
🔒 Unlock Audio Chapter
Sign up and enroll to access the full audio experience
Chapter Content
The project completion time is 20 days, assuming resources are unlimited. If there are constraints like limited cranes, the completion time might increase.
Detailed Explanation
The initial assumption of unlimited resources leads to a calculated completion time for the project of 20 days. However, this is often unrealistic. Real-world projects face constraints such as limited tools or personnel, which can extend the time required to finish the project. In this case, if only two cranes are available, the project will take longer than the initial estimate due to these limitations.
Examples & Analogies
Think of trying to build a lego tower with friends. If everyone brings enough pieces, you could finish quickly. But if only two friends bring their blocks, even though you have a beautiful design in mind, it will take much longer to complete the tower, similar to how cranes impact the project's schedule.
Critical Path Identification
Chapter 4 of 7
🔒 Unlock Audio Chapter
Sign up and enroll to access the full audio experience
Chapter Content
The critical path consists of activities B, E, and I, being the longest path that determines the project's duration.
Detailed Explanation
The critical path is essential because it includes the tasks that directly impact the overall timeline. If any tasks on this path are delayed, the project's finish date will also be delayed. The critical path methodology focuses on identifying these key activities to ensure they are prioritized and managed effectively throughout the project.
Examples & Analogies
Imagine you’re cooking a large meal. If the turkey takes longer to cook than expected, the entire dinner will be delayed. The cooking of the turkey is like the critical path in a project - if it’s delayed, everything else (like the side dishes) needs to adjust to accommodate this delay.
Resource Allocation Strategies
Chapter 5 of 7
🔒 Unlock Audio Chapter
Sign up and enroll to access the full audio experience
Chapter Content
With only two cranes available, the challenge is to allocate them efficiently to minimize idle time and delays.
Detailed Explanation
Efficient resource allocation is crucial to project success. In this scenario, we need to decide how to use the two cranes to cover critical activities first and minimize overall project delay. Strategies like the 'least total float approach' prioritize tasks with minimal float, so resources are devoted where they will make the most impact on timelines.
Examples & Analogies
It’s like a busy restaurant with limited staff. To ensure the best service, the manager assigns the most experienced waiters to the busiest tables first. By working on the tables that can make or break the evening's sales, the restaurant achieves a more efficient operation.
Allocation Decisions and Criteria
Chapter 6 of 7
🔒 Unlock Audio Chapter
Sign up and enroll to access the full audio experience
Chapter Content
Resources should be allocated first to activities with 0 float, then to those with the least latest start time.
Detailed Explanation
When deciding which activities to allocate resources to, the focus should be on critical tasks first. Activities that can be delayed the least (0 float) are prioritized, followed by those whose latest start time is closest to the current timeline. By using these criteria, project managers can ensure that work on the most important tasks is completed first.
Examples & Analogies
Using our restaurant example again, the manager would first assign staff to tables that are completely booked (0 float) and then to those that are just beginning to see customers (least latest start time). This way, they ensure high-demand areas receive the most attention.
Effect of Resource Constraints on Timelines
Chapter 7 of 7
🔒 Unlock Audio Chapter
Sign up and enroll to access the full audio experience
Chapter Content
Due to resource constraints, the completion time is revised from 20 days to 29 days.
Detailed Explanation
Resource limitations inevitably lead to extended project timelines. After identifying the constraints, project managers often must adjust their expectations and budgets accordingly. Recognizing that the original completion timeframe is no longer feasible is important for future planning and stakeholder communication.
Examples & Analogies
It’s similar to planning a family trip. Initially, you might plan to catch an early flight at a lower price. However, if a delay in booking leads to a higher fare for bags and flights, you may have to adjust your travel plans, extending the time and budget necessary for the trip.
Key Concepts
-
Project Network Diagram: A representation of project activities and their relationships.
-
Critical Path: The sequence of activities determining the minimum project duration.
-
Float: Extra time available for an activity without delaying the project.
-
Resource Allocation: The process of assigning available resources to project activities.
Examples & Applications
In a construction project, activity A with a float of 3 days allows for some flexibility in scheduling without delaying overall completion.
If multiple activities depend on a single crane, prioritizing the activity with the least float ensures efficient use of resources.
Memory Aids
Interactive tools to help you remember key concepts
Rhymes
In a project flow from A to Z, the path that’s critical sets time free.
Stories
Imagine a construction site where each worker has a limited number of cranes. They learn that prioritizing the tasks that must be completed on time helps ensure the project finishes successfully.
Memory Tools
C.F.F. - Critical tasks Float Free.
Acronyms
P.N.F. - Project Network Flow illustrates the crucial steps.
Flash Cards
Glossary
- Project Network Diagram
A visual representation of a project showing all activities and their interdependencies.
- Critical Path
The longest path through a project that determines the shortest possible project duration.
- Float
The amount of time that a task can be delayed without delaying the project.
- Resource Constraint
Limitation on the availability of resources required to complete project activities.
Reference links
Supplementary resources to enhance your learning experience.