
Generation of Site Specific Response Spectrum
Enroll to start learning
You’ve not yet enrolled in this course. Please enroll for free to listen to audio lessons, classroom podcasts and take practice test.
Interactive Audio Lesson
Listen to a student-teacher conversation explaining the topic in a relatable way.
Computing Response Spectra
🔒 Unlock Audio Lesson
Sign up and enroll to listen to this audio lesson

Today, we'll learn about computing response spectra. Why do you think it's important to compute them directly from our site-specific ground motion data?

I think it helps to ensure our designs are tailored to the specific conditions at the site.
Exactly! By computing response spectra from actual data, we can better predict how buildings will perform during an earthquake. Typically, we use a 5% damping for these calculations, but why do you think we might also need spectra with different damping levels?

Different structures might behave differently depending on their materials and design, so we need to cover all cases.
Great point! It's crucial to understand various performance scenarios and their implications. Let's summarize that computing response spectra allows us to tailor our designs to local seismic conditions.
Scaling and Averaging of Spectra
🔒 Unlock Audio Lesson
Sign up and enroll to listen to this audio lesson

Now that we've computed the response spectra, how do we make sure they're applicable? One of the techniques is scaling and averaging. Can anyone explain the significance of this process?

Scaling helps fit the spectra to important parameters, like Peak Ground Acceleration or specific periods.
Exactly! This allows us to adjust our spectra to reflect actual seismic expectations. What about averaging?

Averaging combines multiple response spectra into a single one that represents the range of ground motions we've recorded.
Right! An average spectrum provides a comprehensive view of the seismic response and ensures we consider variability in ground motion data.
Smoothening of Spectrum
🔒 Unlock Audio Lesson
Sign up and enroll to listen to this audio lesson
Finally, let’s discuss why smoothening the response spectrum is necessary. What do you think can happen if we use a spectrum with too many irregularities?
It could lead to inaccurate predictions about how structures will respond!
Exactly! Irregularities can result in overly conservative or unsafe designs. By applying statistical smoothening, we enhance the reliability of our spectrum. Can anyone suggest a possible benefit of having a smooth spectrum?
A smooth spectrum makes it easier to interpret and apply in real-world engineering scenarios, for instance, determining which designs to use.
Great answer! So, let’s wrap up by summarizing: smoothening ensures that our generated spectra are not only accurate but also user-friendly for structural applications.
Introduction & Overview
Read summaries of the section's main ideas at different levels of detail.
Quick Overview
Standard
The section details the steps involved in generating a site-specific response spectrum, emphasizing the importance of computing response spectra from ground motion, scaling and averaging across different records, and ensuring a smooth spectrum for practical applicability. The approach improves structural design by providing accurate seismic input tailored to specific site conditions.
Detailed
Generation of Site Specific Response Spectrum
In earthquake engineering, generating a site-specific response spectrum is crucial for ensuring that the seismic design of structures accurately reflects local conditions. This section outlines the following key processes:
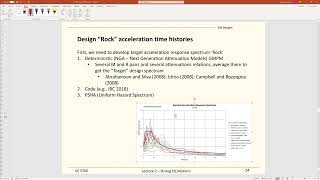
- Compute Response Spectra: For each acceleration time history derived from surface ground motion, response spectra are computed, usually at a standard damping of 5%. However, spectra for varying damping levels, such as 2% or 10%, might also be required to capture different performance scenarios.
- Scaling and Averaging: Each generated response spectrum is then scaled to align with important parameters like Peak Ground Acceleration (PGA) or spectral acceleration at specific periods. The average spectrum is calculated across all records to achieve a representative seismic input.
- Smoothening of Spectrum: Irregularities in the spectral response are mitigated through statistical smoothening or envelope techniques. This step is essential to produce a spectrum that can reliably be applied in design purposes, ensuring the engineered structures can withstand potential seismic events effectively.
The generation of a site-specific response spectrum is imperative for accurate seismic assessment and the application of tailored design solutions that consider local geological factors.
Youtube Videos


Audio Book
Dive deep into the subject with an immersive audiobook experience.
Compute Response Spectra
Chapter 1 of 3
🔒 Unlock Audio Chapter
Sign up and enroll to access the full audio experience
Chapter Content
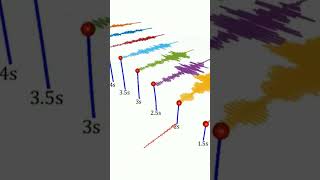
For each acceleration time history obtained from surface ground motion. Typically plotted for 5% damping (standard), but spectra for 2%, 10%, etc., may also be required.
Detailed Explanation
In this step, engineers compute the response spectra based on acceleration time histories collected from ground motion data at the surface. The response spectrum is a graphical representation that illustrates how structures respond to seismic activity at various frequencies. While it's common to plot this spectrum using a standard damping ratio of 5%—representing a typical level of energy dissipation in structures—it's also possible to create spectra for different damping levels, such as 2% or 10%, to assess how structures with varying damping characteristics might perform during an earthquake.
Examples & Analogies
Consider this like tuning a musical instrument. Just as different instruments can produce different sounds depending on how tightly the strings are pulled (analogous to varying damping ratios), structures can respond differently to seismic waves. By calculating response spectra for different damping levels, engineers can understand how a building, like a finely-tuned guitar, would ‘play’ under stress during an earthquake.
Scaling and Averaging
Chapter 2 of 3
🔒 Unlock Audio Chapter
Sign up and enroll to access the full audio experience
Chapter Content
Each response spectrum is scaled (e.g., to match PGA, Sa at T=1s, or spectral shape). Average spectrum is computed across all records.
Detailed Explanation
After calculating individual response spectra, the next step is to scale these spectra to ensure they align with certain seismic metrics, such as Peak Ground Acceleration (PGA) or Spectral Acceleration (Sa) at specific periods like T=1s. This scaling is crucial because it allows engineers to adjust the spectra to match the expected performance of structures based on recorded seismic events. Finally, an average spectrum is generated from all individual spectra, providing a balanced representation that incorporates variability from multiple records.
Examples & Analogies
Imagine you're collecting temperature readings from different weather stations in a city. Just as you would average the temperatures to get a reliable idea of the city's overall climate, scaling and averaging response spectra helps engineers get a reliable picture of seismic demands on buildings. This way, they don’t base decisions on an outlier or extreme event that might not represent typical conditions.
Smoothening of Spectrum
Chapter 3 of 3
🔒 Unlock Audio Chapter
Sign up and enroll to access the full audio experience
Chapter Content
Apply statistical smoothing or envelope to remove irregularities. Ensure the spectrum is representative and practical for design purposes.
Detailed Explanation
In this phase, statistical techniques are applied to the averaged response spectrum to smooth out any erratic variations or irregularities that may arise from random fluctuations in the data. The goal is to create a more consistent and polished spectrum that accurately reflects the realistic seismic behavior of structures. This step is vital to ensure that the resulting spectrum is not only representational of the site-specific conditions but also useful for practical design applications.
Examples & Analogies
Think of smoothening a rough piece of wood before it can be used in furniture making. Just as carpenters sand down rough surfaces to achieve a smooth finish that enhances both the appearance and usability of the wood, engineers smoothen response spectra to achieve a more usable and visually coherent representation of seismic data, which can lead to more effective structural designs.
Key Concepts
-
Computing Response Spectra: Involves calculating spectra from actual ground motion to reflect site-specific conditions.
-
Scaling: Adjusting response spectra to match key seismic parameters ensures practicality and applicability for structural design.
-
Smoothing: Enhances the usability of spectra by reducing irregularities, yielding a more reliable design input.
Examples & Applications
If a structure is built in a soft soil region, the generated response spectrum will reflect higher amplification effects compared to a structure on hard rock.
In a seismic design review, engineers might compare the site-specific response spectrum to a code-based spectrum to identify necessary adjustments.
Memory Aids
Interactive tools to help you remember key concepts
Rhymes
To compute the spectra, take ground motion's best shot; scale and smooth it, that's how design's got!
Stories
Once upon a time, engineers faced earthquakes in a city. They computed their spectra from the ground, scaled it to fit their needs, and smoothened all rough edges. They designed buildings that stood tall and safe thanks to their careful work!
Memory Tools
C-S-S: Compute, Scale, Smooth - the steps for a usable response spectrum.
Acronyms
RSG
Response Spectrum Generation
refers to the entire process from computation to smoothening.
Flash Cards
Glossary
- Response Spectrum
A graphical representation that relates the maximum response of a structure to seismic ground motion as a function of period or frequency.
- Peak Ground Acceleration (PGA)
The maximum acceleration recorded at a given location during an earthquake.
- Damping
A measure of how oscillations in a system decay after a disturbance, expressed as a percentage.
- Scaling
The process of adjusting the amplitude of a response spectrum to match specific seismic design parameters.
- Smoothening
The process of removing irregularities from a response spectrum to enhance its usability for design.
Reference links
Supplementary resources to enhance your learning experience.