
Sample Analysis Techniques
Enroll to start learning
You’ve not yet enrolled in this course. Please enroll for free to listen to audio lessons, classroom podcasts and take practice test.
Interactive Audio Lesson
Listen to a student-teacher conversation explaining the topic in a relatable way.
Introduction to Surrogates
🔒 Unlock Audio Lesson
Sign up and enroll to listen to this audio lesson

Today, we'll be discussing an important topic in environmental quality analysis—surrogates. Can anyone tell me what a surrogate is?

Isn't it a compound that behaves like the analyte we want to measure?
Exactly! Surrogates help us calculate recovery rates of the analytes. Remember, the acronym for our steps is S.E.C. for Surrogate, Extract, Concentrate. Can you use that to remember the overall process?

S.E.C. for Surrogate, Extract, Concentrate! Got it!
Good! Now, what do we do with these surrogates after adding them to our samples?

We analyze the result to see how much of the surrogate was recovered, right?
Correct, and from there we can backtrack to find how much of the analyte might have been lost.
Extraction Process
🔒 Unlock Audio Lesson
Sign up and enroll to listen to this audio lesson

Let's move on to the extraction process. When we extract compounds like our surrogates, we often use hexane. Why do you think hexane is chosen?

Because it separates well from water, right?
Exactly! Hexane helps in effectively separating organic compounds. Now, when we extract from 50ml to 40ml, what do we do next?
We need to concentrate that down to make the analytes detectable!
Spot on! Can anyone recall how we typically achieve concentration?
By evaporation, using rotary evaporators or air flow, right?
Great recall! Remember that evaporation increases the concentration of our analytes, making them easier to measure.
Calibration and Data Interpretation
🔒 Unlock Audio Lesson
Sign up and enroll to listen to this audio lesson
Now that we have our concentrated sample, we need to analyze the response using calibration. Why do we employ calibration?
To ensure accurate measurements of concentration, right?
Yes! We create a calibration curve to relate mass to instrument response. A good way to remember it is M.C.R. for Mass, Calibration, Response. What does it tell us?
It helps translate our raw data into a meaningful concentration or mass!
Exactly! And after measuring our response, what crucial step follows?
We backtrack to see how much analyte we might have recovered.
Well done! This back calculation checks our analysis efficiency.
Assessment of Recovery Efficiency
🔒 Unlock Audio Lesson
Sign up and enroll to listen to this audio lesson
Finally, let’s talk about recovery efficiency. After we've calculated our findings, how do we assess if our method is effective?
By comparing the recovered amount to what we initially added!
Exactly! If the recovery is less than expected, what might that indicate?
It could mean there were losses during the process, or our calibration might be off!
Great insights! Always remember that understanding where losses occur is crucial in refining our methods.
Introduction & Overview
Read summaries of the section's main ideas at different levels of detail.
Quick Overview
Standard
The section explains how surrogate compounds are used to estimate the recovery of analytes during sample analysis. It provides detailed methods for extraction, concentration, and calibration processes, emphasizing the significance of accurate calculations to understand recovery rates and potential losses.
Detailed
Detailed Summary of Sample Analysis Techniques
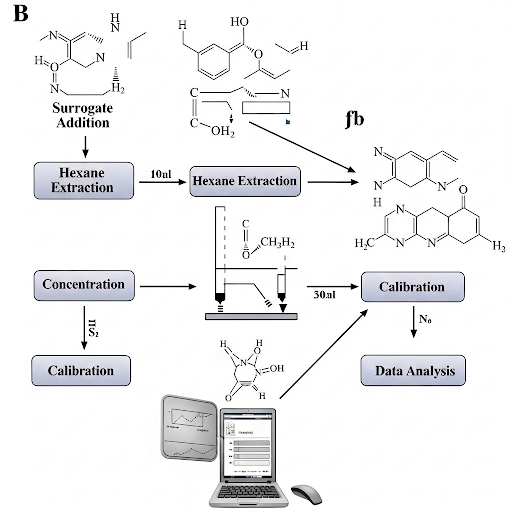
This section elaborates on the techniques used in sample analysis to evaluate environmental quality. It introduces surrogates, which are compounds mimicking the behavior of the analytes of interest. The process begins with adding a surrogate compound to a water sample for extraction. In this case, a 1L sample receives a 1mL addition of a 100mg/L surrogate solution.
Key Steps in Sample Analysis:
- Surrogate Addition: The addition of a surrogate helps in calculating recovery efficiencies.
- Extraction Procedure: An extraction is performed using hexane, where a specified volume (50mL) is used to separate the phases (water and hexane). The practical aspects of taking a smaller volume (40mL) are also noted, addressing the difficulty in separating residual solvents cleanly.
- Concentration: The extracted 40mL is concentrated down to a smaller volume (1mL), often via evaporation methods including rotary evaporators or nitrogen gas, which increases the analyte's concentration and improves detectability in further analyses.
- Calibration: Using a calibration curve, the response of an unknown sample is translated back into concentration or mass, ensuring the extraction was effective. The surrogate helps to cross-validate the recovery of the analyte.
- Back Calculations: Analyzing the difference between expected and recovered amounts reveals efficiency and highlights any procedural issues.
- Comparison with Standards: Ultimately, comparing the calculated concentrations with the initial amounts added helps assess analytical accuracy.
These techniques illustrate the complexity and the precision required in environmental monitoring and analysis.
Youtube Videos


Audio Book
Dive deep into the subject with an immersive audiobook experience.
Understanding Surrogates
Chapter 1 of 5
🔒 Unlock Audio Chapter
Sign up and enroll to access the full audio experience
Chapter Content
So the problem relates to, you have a sample, 1 liter. To this, we are adding 1 ml of 100 milligram solution of a surrogate. The surrogate is a compound that likely behaves like the analyte of interest. The surrogate is expected to behave like the main compound and we calculate the efficiency of recovery of the analyte by using the efficiency of recovery of the surrogate.
Detailed Explanation
In analytical chemistry, especially in environmental monitoring, a surrogate is used to assess the recovery efficiency of the process. Here, a 1-liter sample is treated with a 1 ml solution containing 100 mg of a surrogate. The idea is that this surrogate behaves similarly to the analyte, which is the actual substance being measured. The recovery efficiency indicates how much of the analyte can be expected to be detected during analysis, allowing for more accurate results.
Examples & Analogies
Imagine you're trying to measure the sweetness of a specific fruit juice. You might add a known amount of sugar (the surrogate) to help understand how well your measuring technique works. If you know how much sugar you added and how much you recovered in your measurement, you can estimate how much sweetness is present in the juice itself.
Extraction Procedure with Hexane
Chapter 2 of 5
🔒 Unlock Audio Chapter
Sign up and enroll to access the full audio experience
Chapter Content
The sample was extracted with 50 ml of hexane. All of the surrogate gets into 50 ml. So the idea is whatever is extracted, it gets into this 50 ml. Now out of this 50, we only take 40 ml into a smaller vial, this is the extract.
Detailed Explanation
The extraction process involves adding a solvent, in this case, hexane, to isolate the analyte and surrogate from the water sample. Here, 50 ml of hexane is used, and after extraction, only 40 ml is separated for analysis. This is due to practical considerations, ensuring that excess water is not included in the analysis.
Examples & Analogies
Think of making a cup of tea. You steep tea leaves in hot water, causing the flavors to infuse into the water (hexane). After some time, you might pour out only a portion of the tea (40 ml) to avoid some of the leaves that remained at the bottom (excess water) which could alter the taste you're trying to measure.
Concentration Process
Chapter 3 of 5
🔒 Unlock Audio Chapter
Sign up and enroll to access the full audio experience
Chapter Content
The extract was further concentrated to 1 ml. This concentration is typically achieved by evaporation.
Detailed Explanation
After extraction, the solution is evaporated down to a smaller volume—1 ml in this case—to increase the concentration of the analyte. This ensures that even trace levels are detectable. Different pieces of equipment like rotary evaporators may be used for this purpose, allowing the extraction of smaller volumes.
Examples & Analogies
This is like cooking pasta and reducing sauce. You boil the sauce to let some water evaporate, intensifying the flavors. By reducing the sauce volume, the remaining ingredients (like spices) become more concentrated and flavorful.
Calibration and Mass Calculation
Chapter 4 of 5
🔒 Unlock Audio Chapter
Sign up and enroll to access the full audio experience
Chapter Content
The response here says calibration and its response = 60,000 × m, where m is mass of the analyte in nanograms. An instrument response was obtained to be 80,000 units. Therefore, the mass of the analyte is calculated as 80,000 divided by 60,000 is 1.3 nanograms.
Detailed Explanation
Calibration is crucial for quantifying the amount of analyte present. A linear relationship is established where the instrument response correlates to the mass of the analyte through a simple mathematical formula. By obtaining the response from the instrument and comparing it with the calibration, the mass of the analyte can be determined accurately.
Examples & Analogies
Consider a school test where scores are converted to grades. If 60,000 points equate to an 'A' grade and a student scores 80,000 points, you can calculate that the student is significantly above average (or performing well) by applying the same conversion scale. Similarly, the instrument converts raw response to useful data about the analyte.
Calculating Recovery Efficiency
Chapter 5 of 5
🔒 Unlock Audio Chapter
Sign up and enroll to access the full audio experience
Chapter Content
To calculate how much of the surrogate is there in the original extract, we compare the amount recovered to the amount that was added initially. This ensures that the recovery efficiency is accurately reflective of the process effectiveness.
Detailed Explanation
Calculating recovery efficiency involves determining what was recovered relative to what was initially added. This percentage gives insights into how effective the extraction process was, and influences future analyses. If the recovery is low, it may suggest issues either with the extraction process or the methodology used.
Examples & Analogies
It’s similar to baking a cake and checking if all the ingredients are properly represented in the final product. If you added 100g of sugar and only taste 1g in your slice, something went wrong in the baking (the process) because the expected flavor (recovery) is not there.
Key Concepts
-
Surrogate Recovery: A strategy in analytical chemistry utilizing similar compounds to evaluate recovery rates of the target analyte.
-
Extraction Processes: Utilizing solvents like hexane for effectively separating components in a mixture.
-
Calibration Importance: Establishing relationships between measured responses and known standards is fundamental in quantitative analysis.
-
Recovery Efficiency Assessment: The calculated recovery from analysis gives insight into the accuracy and efficacy of the analytical method.
Examples & Applications
For instance, if a surrogate with an initial known mass of 100 micrograms yields a recovery of 80 micrograms, the recovery efficiency would be calculated as (80/100) * 100 = 80%.
After extracting a water sample using hexane and concentrating it, if the instrument response indicates a mass of analyte, the concentration can be back-calculated via calibration curves.
Memory Aids
Interactive tools to help you remember key concepts
Rhymes
To find the right amount to trace, surrogates help us in the race.
Stories
Imagine a detective (the surrogate) who mirrors the suspect (the analyte) perfectly. The detective's skills help uncover the suspect’s path with precision.
Memory Tools
S>E>C stands for Surrogate, Extraction, Concentration—remember the crucial steps in analysis!
Acronyms
MCR
Mass
Calibration
Response—important concepts in analyzing data.
Flash Cards
Glossary
- Surrogate
A compound that behaves like the analyte of interest used to estimate recovery efficiencies in analyses.
- Extraction
A process of separating a compound from a mixture or solution, typically using a solvent.
- Calibration
A method to establish the relationship between known values (standards) and the output response of an instrument.
- Recovery Efficiency
A measure of how much of the analyte is recovered from the sample during analysis, typically expressed as a percentage.
- Hexane
An organic solvent commonly used in extractions due to its ability to separate from water and dissolve organic compounds effectively.
Reference links
Supplementary resources to enhance your learning experience.