
Case Studies and Problem Scenarios
Enroll to start learning
You’ve not yet enrolled in this course. Please enroll for free to listen to audio lessons, classroom podcasts and take practice test.
Interactive Audio Lesson
Listen to a student-teacher conversation explaining the topic in a relatable way.
Understanding Sherwood Number
🔒 Unlock Audio Lesson
Sign up and enroll to listen to this audio lesson

Today, we're going to talk about the Sherwood number, which is a crucial dimensionless number in mass transfer. Does anyone know what it represents?

Is it related to convection and diffusion?
Exactly, Student_1! The Sherwood number, or NSh, gives us the ratio of convective mass transport to diffusive mass transport. It helps us understand how efficiently materials are transferred in a fluid environment.

So, a higher Sherwood number means better mass transfer?
Yes, that’s right! When we calculate mass transfer coefficients using Sherwood number, we can better assess processes in lakes or rivers. Remember, NSh also varies based on factors like flow geometry.

How do we actually calculate it?
Good question, Student_3! The formula relates kA, a mass transfer coefficient, with a characteristic length and diffusion coefficients. It helps in creating correlations for different systems.

Can you give us an example of where this is applied?
Certainly! For instance, in oil spill scenarios, understanding NSh helps predict how quickly the oil will dissipate in the environment. Let’s recap: the Sherwood number links convection and diffusion and is pivotal in environmental assessments.
Exploration of Reynolds Number
🔒 Unlock Audio Lesson
Sign up and enroll to listen to this audio lesson

Now, let’s shift gears and talk about the Reynolds number. What does it tell us about flow?
I think it helps us determine whether the flow is laminar or turbulent?
Correct! The Reynolds number, Re, indicates whether a flow regime is laminar or turbulent based on the ratio of inertial forces to viscous forces. A high Re usually suggests turbulent flow.
What are the implications of this in environmental scenarios?
In chemical and environmental engineering, knowing whether flow is laminar or turbulent can help predict how substances mix and spread, which is crucial in situations such as river pollutant transportation.
How do we use it alongside the Sherwood number then?
Great connection! Both Reynolds and Sherwood numbers are often used together to form correlations that accurately model mass transfer in fluids. For example, in rivers, the flow's turbulence affects the mass transfer rates significantly.
So, both concepts are interconnected in environmental assessments?
Absolutely! By understanding both NSh and Re, we can derive meaningful insights for various environmental contexts. Remember, high turbulent flow generally leads to higher mass transfer rates. Summarizing, Re helps us determine the flow regime, which is essential for understanding mass transport processes.
Case Studies in Environmental Assessment
🔒 Unlock Audio Lesson
Sign up and enroll to listen to this audio lesson
Let’s look at a case study involving hydrocarbon spills. What happens when a barge spills oil into a river?
Well, I guess some of it would float while some would sink?
Exactly! With dense non-aqueous phase liquids (DNAPLs) sinking and light non-aqueous phase liquids (LNAPLs) floating, we see differing behaviors. This leads to complex interactions with the sediment and water.
What kind of processes can we expect?
Great question! There are several processes at play: evaporation, dissolution into water, and spreading in sediment. These processes are dependent on the environmental conditions and need thorough analysis.
How do we assess risks in these situations?
Risk assessment includes calculating steady-state fluxes for the substances involved and understanding their concentrations over time. Remember, each interface in the spill behaves differently, which complicates predictions.
What’s the role of our earlier concepts here?
All of our earlier concepts come into play! The Sherwood and Reynolds numbers help us develop models for predicting mass transfer, which are essential in these risk assessments. In summary, oil spill case studies showcase the real-world application of theoretical mass transfer principles.
Introduction & Overview
Read summaries of the section's main ideas at different levels of detail.
Quick Overview
Standard
The section outlines the significance of case studies and problem scenarios in understanding the complexities of environmental quality monitoring. It emphasizes the role of Sherwood number, Reynolds number, and other correlations in predicting mass transfer processes in real-world applications such as oil spills in aquatic environments.
Detailed
Case Studies and Problem Scenarios
In this section, several real-world case studies and problem scenarios are presented, shedding light on the application of interphase mass transfer concepts in environmental quality monitoring. The discussion begins with the Sherwood number (NSh), defined as the ratio of convective mass transport to diffusive mass transport, which is vital for understanding fluid dynamics in various systems such as rivers and lakes.
The section further elaborates on the Reynolds number (Re) and the Schmidt number (Sc), crucial parameters that help identify flow patterns and mixing in different mediums. These numbers serve to evaluate how mass is transported in various environmental contexts including lakes, rivers, and affected sediment.
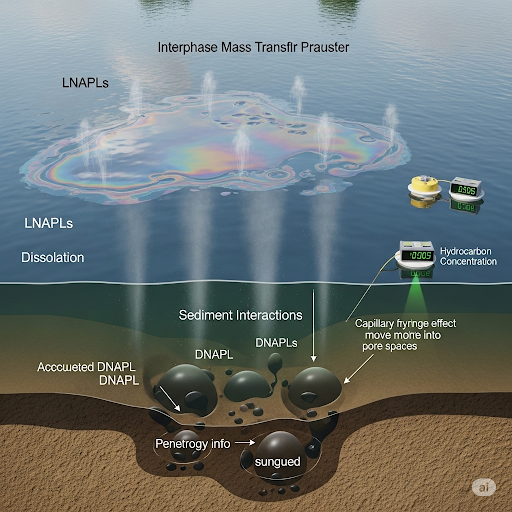
Particular attention is given to the case of hydrocarbon spills, where detailed risk assessments are required to understand the effects of dense non-aqueous phase liquids (DNAPLs) and light non-aqueous phase liquids (LNAPLs) on water bodies. Notably, it details how these spills undergo multiple processes such as evaporation, dissolution, and spreading, and how sediment interactions significantly influence these processes.
This section serves as an exploration of the challenge in accurately modeling environmental scenarios influenced by mass transport and provides a roadmap of potential methodologies for future studies and environmental risk assessments.
Youtube Videos


Audio Book
Dive deep into the subject with an immersive audiobook experience.
Oil Spill Case Study Overview
Chapter 1 of 5
🔒 Unlock Audio Chapter
Sign up and enroll to access the full audio experience
Chapter Content
There is a barge of vessel carrying heavy loads on water at 1000 tons of a mixture of hydrocarbons, 500 tons of this oil is a dense NAPL, and the rest is a light NAPL and it spills. What will happen?
Detailed Explanation
This chunk introduces a specific oil spill scenario involving a barge carrying a heavy load of hydrocarbons. NAPL stands for Non-Aqueous Phase Liquid, which refers to oil that doesn't mix well with water. In this case, there are two types of NAPL: dense (DNAPL) and light (LNAPL). When the barge spills, the dense oil (DNAPL) tends to sink and spread in the water bottom, while the light oil (LNAPL) floats on the surface. This sets the stage for various environmental impacts and necessitates a risk assessment, as both types will influence the local ecosystem in different ways.
Examples & Analogies
Imagine a massive cargo ship loaded with two types of oil — one being heavier and the other lighter. Picture an accident in which a portion of this cargo spills into the ocean. The lighter oil forms a slick on the water's surface, affecting marine life on the top. Meanwhile, the heavier oil sinks to the ocean floor, threatening creatures living in the sediments. This scenario is a relevant real-world analogy to the discussed oil spill case.
Risk Assessment Processes
Chapter 2 of 5
🔒 Unlock Audio Chapter
Sign up and enroll to access the full audio experience
Chapter Content
In this problem, what will be your risk assessment? Several processes are happening: evaporation, dissolution, and contamination spreading downwards into the sediment.
Detailed Explanation
This chunk discusses the processes involved after an oil spill and the need for a risk assessment. Key processes following a spill include evaporation (where lighter components of the oil vaporize), dissolution (where some oil may dissolve into the water), and the spreading of contaminants from the water’s surface into the sediment below. Each of these processes can have different environmental impacts and requires understanding to assess the overall risk linked to the spill.
Examples & Analogies
Consider pouring a drop of food coloring into a glass of water. As time passes, you’ll see the color dispersing throughout the water (dissolution) and some might even evaporate if left outside. In an oil spill, similar processes occur but with potentially toxic materials. Understanding these processes helps predict the impacts of spills on water and sediment environments.
Interfaces in Environmental Processes
Chapter 3 of 5
🔒 Unlock Audio Chapter
Sign up and enroll to access the full audio experience
Chapter Content
Here, there are several interfaces at play: evaporation at the air-water interface, sediment contamination, and diffusion within the sediment itself.
Detailed Explanation
This chunk highlights the interfaces involved during the oil spill event. The air-water interface is where evaporation occurs, while sediment contamination happens at the bottom where oils settle. Additionally, diffusion processes occur in the sediment as contaminants spread through it over time. Recognizing these interfaces is crucial for understanding how oil affects different environmental compartments.
Examples & Analogies
Think of a sponge soaking up a colored liquid; at first, the color is at the surface, but over time, it seeps deep into the sponge (analogous to diffusion in sediment). Also, imagine being on a beach where the tide brings in oil — you see it on the water at first. As time passes, some of that oil evaporates (air-water interface) and some seep into the sand (sediment), marking both the evaporation and sediment interfaces' effects.
Steady State Calculations
Chapter 4 of 5
🔒 Unlock Audio Chapter
Sign up and enroll to access the full audio experience
Chapter Content
I can calculate steady state fluxes, assuming concentrations are constant. If concentrations change, I need to use an unsteady state balance.
Detailed Explanation
This chunk explains the difference between steady state and unsteady state calculations in environmental scenarios. Steady state assumes that concentrations of contaminants remain relatively constant over time, allowing simple calculations of fluxes at various interfaces. However, if concentrations change, more complex unsteady state models must be deployed, taking into consideration the time dynamics and initial conditions of the spill.
Examples & Analogies
Imagine a bathtub filling with water at a constant rate (steady state). As long as the flow matches the drain, the water level stays the same. If you open the drain wider, the water will start to empty more quickly (unsteady state), leading to changes in the water level. In an oil spill, understanding whether the concentrations of pollutants are stable or changing over time is crucial to accurately describe the situation's dynamics.
Long-Term Environmental Impacts
Chapter 5 of 5
🔒 Unlock Audio Chapter
Sign up and enroll to access the full audio experience
Chapter Content
This will give you a very good idea of what we call as fate and transport because fate and transfer occur over a long time and it is not a quick thing that happens.
Detailed Explanation
This chunk emphasizes the long-term nature of contamination following an oil spill. The terms 'fate' and 'transport' refer to how contaminants behave and move through the environment over time. These processes can take decades, and understanding their dynamics is crucial for risk assessment and environmental policy. Knowledge of long-term effects aids in evaluating the risks associated with contaminated sites.
Examples & Analogies
Consider rotting fruit left in a room. It doesn’t just spoil instantly but gradually releases odors, attracts insects, and changes the environment around it. Similarly, when oil spills occur, contaminants alter the environment slowly, necessitating long-term monitoring to fully understand their impact.
Key Concepts
-
Mass Transfer: The process by which different substances move from one phase to another.
-
Fluid Dynamics: Study of fluids in motion, crucial for understanding mass transfer.
-
Environmental Risk Assessment: Evaluation of potential risks and impacts from environmental contaminants.
Examples & Applications
In an oil spill scenario, the Sherwood number helps predict how long it will take for the oil to disperse and what portion will evaporate.
When assessing a river's pollution from industrial effluents, the Reynolds and Schmidt numbers help define how pollutants will spread throughout the water.
Memory Aids
Interactive tools to help you remember key concepts
Rhymes
In oil spills we can see, how liquids will behave with glee. DNAPLs sink while LNAPLs float, understanding this can help us gloat.
Stories
Once a barge spilled oil in a river, half sank deep, and half did quiver. The spreading and mixing were quite a sight, scientists gathered to measure the plight.
Memory Tools
For mass transport think S-Re; Sherwood for convective fleets, Reynolds for fluid fleets.
Acronyms
MRDS - Mass Transfer (M), Reynolds (R), Density (D), Spills (S) - important concepts in environmental scenarios.
Flash Cards
Glossary
- Sherwood Number (NSh)
A dimensionless number representing the ratio of convective mass transport to diffusive mass transport.
- Reynolds Number (Re)
A dimensionless quantity used to predict flow patterns in different fluid flow situations.
- Schmidt Number (Sc)
A dimensionless number that represents the ratio of momentum diffusivity (kinematic viscosity) to mass diffusivity.
- DNAPL
Dense Non-Aqueous Phase Liquid that tends to sink in water.
- LNAPL
Light Non-Aqueous Phase Liquid that tends to float on water.
- Risk Assessment
The process of evaluating potential risks that may be involved in a projected activity or undertaking.
Reference links
Supplementary resources to enhance your learning experience.