
Laboratory Soil Specimen and Testing Procedure
Enroll to start learning
You’ve not yet enrolled in this course. Please enroll for free to listen to audio lessons, classroom podcasts and take practice test.
Interactive Audio Lesson
Listen to a student-teacher conversation explaining the topic in a relatable way.
Introduction to Soil Specimen Testing
🔒 Unlock Audio Lesson
Sign up and enroll to listen to this audio lesson

Today, we’re starting with compression testing of fine-grained soils. Who can explain what compressibility means?

Compressibility is how much a soil can change its volume when subjected to stress.
Exactly! And the compressibility is often measured in terms of the void ratio. Does anyone remember how we express the relationship between void ratio and effective stress?

I think it's shown on a graph where the x-axis is the effective stress and the y-axis is the void ratio.
Correct! This relationship is critical. Now, let’s introduce the testing procedures for obtaining our soil specimen.
Understanding the Consolidation Process
🔒 Unlock Audio Lesson
Sign up and enroll to listen to this audio lesson

Let’s discuss the actual consolidation test. What happens during this test?

We apply pressure increments and wait for void ratio to stabilize.
Right! Each pressure increment lasts 24 hours to allow equilibrium. Can anyone tell me why we maintain this duration?

It’s to ensure that the soil fully responds to the applied stress so we get accurate measurements.
Exactly! And at the end of each increment, we record the void ratio before applying more pressure.
Exploring the Compression Paths
🔒 Unlock Audio Lesson
Sign up and enroll to listen to this audio lesson
Now let’s visualize the paths taken during compression. What do we see in the loading process?
At first, it follows path AB with less compression, then moves to BC for a lot more compression.
Spot on! And how does unloading affect this?
It traces back along path CD. But some deformation remains, right?
Correct! That's what we call permanent strain. Remember, the soil shows different behaviors upon reloading as well.
Summarizing Soil Behavior
🔒 Unlock Audio Lesson
Sign up and enroll to listen to this audio lesson
What would you summarize as the key points we’ve learned today?
We learned about the various stages of soil compression, including AB and BC, and how soil returns to CD during unloading.
Also, about permanent strain and the hysteresis loop between unloading and reload paths.
Great summary! The understanding of these concepts is crucial for engineering applications when predicting soil behavior under load.
Introduction & Overview
Read summaries of the section's main ideas at different levels of detail.
Quick Overview
Standard
The laboratory testing of fine-grained soil involves extracting a specimen and subjecting it to one-dimensional consolidation to study how compressibility is affected by changes in void ratio and effective stress. Key concepts include the virgin compression curve, elastic recovery, and the behavior of soil during loading and unloading.
Detailed
Laboratory Soil Specimen and Testing Procedure
This section covers the procedure for testing the compressibility of fine-grained soils in a laboratory setting. A cylindrical soil specimen, with a diameter of 60 mm and a height of 20 mm, is extracted from an undisturbed soil sample. The specimen undergoes one-dimensional (1D) consolidation under various pressure increments, each maintained for 24 hours until equilibrium is reached, allowing for the recording of the void ratio.
Key Points:
- Void Ratio vs. Effective Stress: Understanding how compressibility is influenced by the relationship between void ratio and effective stress is fundamental in soil mechanics.
- Consolidation Test: The soil sample follows distinct paths of behavior during loading, unloading, and reloading.
- AB: Initial, less compressible phase (Recompression Path).
- BC: Virgin compression curve or Normal consolidation line indicating significant compression under increasing stress.
- CD: Expansion during unloading, which shows the path of strain recovery.
- Permanent Strain and Elastic Recovery: After unloading, the soil may undergo irreversible deformation, yet a certain elastic recovery is still possible.
- Hysteresis Effect: The differences between reloading and unloading paths create a hysteresis loop, indicating the complexities of soil behavior under varying loads.
Mastering these concepts assists in understanding a soil's behavior, providing essential data for engineering applications.
Youtube Videos


Audio Book
Dive deep into the subject with an immersive audiobook experience.
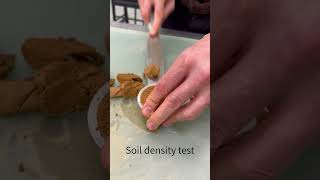
Soil Specimen Extraction
Chapter 1 of 7
🔒 Unlock Audio Chapter
Sign up and enroll to access the full audio experience
Chapter Content
A laboratory soil specimen of dia 60mm and height 20mm is extracted from the undisturbed soil sample obtained from the field.
Detailed Explanation
In this step, we extract a small cylinder of soil from the original, undisturbed sample taken from the field. The dimensions of this specimen are 60mm in diameter and 20mm in height. This is crucial because maintaining the soil's natural structure as much as possible ensures accurate test results when we assess its behavior under load.
Examples & Analogies
Think of this like taking a slice from a cake. If you want to evaluate the texture and flavor of the cake, you need to cut a slice carefully without disturbing it too much. If you were to crumble the cake before taking your slice, it would no longer reflect the original cake's qualities.
1D Consolidation Testing
Chapter 2 of 7
🔒 Unlock Audio Chapter
Sign up and enroll to access the full audio experience
Chapter Content
This sample is subjected to 1D consolidation in the lab under various pressure increments. Each pressure increment is maintained for 24 hrs and equilibrium void ratio is recorded before the application of the next pressure increment.
Detailed Explanation
The extracted soil sample undergoes a test called one-dimensional consolidation. In this test, the specimen is placed under increasing amounts of pressure - also known as load - incrementally. After applying each load, the sample is left for 24 hours, allowing it to settle and stabilize. This period lets us measure how much the soil compresses, specifically recording the 'voids ratio,' which reflects the amount of empty space in the soil compared to the volume of solids.
Examples & Analogies
Imagine stacking books on a soft mattress. As you put more books on, the mattress compresses. After some time, the mattress stops changing shape significantly even when more books are added. This is similar to how soil behaves under load in the consolidation test.
Plotting Compressibility
Chapter 3 of 7
🔒 Unlock Audio Chapter
Sign up and enroll to access the full audio experience
Chapter Content
Then a plot of void ratio versus effective stress is made as shown in above figure.
Detailed Explanation
After completing the 1D consolidation test, we create a graph that plots the void ratio against the effective stress applied. The effective stress is the stress that contributes to the soil's ability to support loads, minus the pore water pressure in the soil. This plot helps us visualize the relationship between how compacted the soil becomes (void ratio) as the pressure increases.
Examples & Analogies
Think of this graph as a visual representation of how much a sponge compresses when you squeeze it. The more you squeeze (increase effective stress), the lesser the air and water pockets are inside (the void ratio decreases).
Compression Paths
Chapter 4 of 7
🔒 Unlock Audio Chapter
Sign up and enroll to access the full audio experience
Chapter Content
When the sample is recompressed from point D it follows DE and beyond C it merges along BCF and it compresses as it moves along BCF.
Detailed Explanation
As we analyze the outcomes from the plot, we notice different paths the soil specimen takes during compression. When recompressed, the soil initially follows a certain path labeled as DE. Then, as we increase the load beyond a certain point (C), the behavior changes and the path merges into a new line that reflects further compression patterns labeled as BCF. This shows how the soil's response to pressure changes based on its previous loading history.
Examples & Analogies
Imagine inflating a balloon. When you first start blowing air into it, the balloon expands easily. But as the balloon gets bigger, it becomes harder to inflate—it follows a different path of expansion due to the way the rubber stretches. Similarly, the soil's behavior changes as it gets loaded.
Recompression and Virgin Compression
Chapter 5 of 7
🔒 Unlock Audio Chapter
Sign up and enroll to access the full audio experience
Chapter Content
During the initial stages (at low effective stress) sample follows recompression path (portion AB) and undergoes less compression. Beyond this is the virgin compression line (portion BC) also called the normal compression line and the sample undergoes large compression.
Detailed Explanation
The graph established in our earlier step indicates that at low effective stress, the soil operates along a path called the recompression path (AB). Here, it exhibits minimal compression. Once we move beyond this stage, we enter the 'virgin compression' region (BC), which shows a substantial increase in compression with added stress. This differentiation is important in understanding how previously loaded soil behaves compared to untouched soil.
Examples & Analogies
Think about a spring. When you gently compress it (low stress), it doesn’t change much. But if you apply more force (beyond the spring's natural position), it compresses significantly and is more noticeable. The spring's response mirrors the soil behavior in low versus high stress.
Unloading and Permanent Strain
Chapter 6 of 7
🔒 Unlock Audio Chapter
Sign up and enroll to access the full audio experience
Chapter Content
From ‘C’ when the sample is unloaded, sample expands and traces path CD (expansion curve unloading). Sample undergoes Permanent strain due to irreversible soil structure and there is a small elastic recovery.
Detailed Explanation
When the load on the soil sample is removed from point C, the sample will start to expand again, retracing a path labeled as CD. However, it's noteworthy that some deformation is permanent even after unloading, indicating that soil structure has changed irreversibly. There's also a minor elastic recovery, where the soil partially returns to its original shape. This behavior showcases the differences between how materials react elastically (they return to original shape) versus plastically (they retain some deformation).
Examples & Analogies
Picture a piece of clay: If you press it down, it flattens out (compresses), but when you lift the pressure, it doesn't spring back entirely to its original shape. Some of the flattening remains, demonstrating similar behavior to how soil behaves under and after pressure.
Reloading and Hysteresis
Chapter 7 of 7
🔒 Unlock Audio Chapter
Sign up and enroll to access the full audio experience
Chapter Content
When the sample is reloaded-reloading curve lies above the rebound curve and makes a hysteresis loop between expansion and reloading curves.
Detailed Explanation
When the specimen is subjected to reloading, the response follows a different curve that lies above the previous rebound curve, creating what is identified as a hysteresis loop. This loop illustrates the differences between the soil's response during unloading and reloading, showcasing how previous loading alters the daily performance of the soil. The area between the loading and unloading paths signifies the energy lost (hysteresis).
Examples & Analogies
This can be likened to a rubber band. If you stretch it multiple times, each successive stretch may not return to exactly the same shape as before, and there might be some slack or energy loss. Similarly, each reloading alters how the soil behaves compared to its initial state.
Key Concepts
-
Compression and Consolidation: The process of soil volume reduction under load.
-
Effective Stress Principle: Understanding how forces from load and pore pressures interact.
-
Recompression Path: The behavior of soil under initial loading conditions.
-
Virgin Compression Curve: The path followed during the saturation of soil.
-
Hysteresis Loop: The graphical representation of loading and unloading behavior.
Examples & Applications
A laboratory soil specimen of diameter 60 mm and height 20 mm undergoes testing to measure compressibility.
During consolidation, the void ratio stabilizes after each pressure increment indicating how soil responds to stress.
Memory Aids
Interactive tools to help you remember key concepts
Rhymes
Under the load, the soil does act, volume reduced, as a fact!
Stories
Imagine a sponge under weight absorbing pressure. When released, it only partially returns, remembering the load it bore.
Memory Tools
Remember A-B-C: At first, it compresses lightly (A to B), then heavily (B to C), showing the virgin compression line.
Acronyms
C.E.P.E
Compressibility
Effective Stress
Permanent Strain
Elastic Recovery - key concepts to grasp!
Flash Cards
Glossary
- Void Ratio
The ratio of the volume of voids to the volume of solids in a soil sample.
- Effective Stress
The stress that contributes to the strength of soil and is calculated as total stress minus pore water pressure.
- Virgin Compression Curve
The path that soil follows during initial loading, representing greater compressibility.
- Permanent Strain
The irreversible deformation of soil resulting from loading beyond its elastic limit.
- Elastic Recovery
The ability of soil to regain its original shape after load removal, to some extent.
Reference links
Supplementary resources to enhance your learning experience.