
Virgin Compression Curve
Enroll to start learning
You’ve not yet enrolled in this course. Please enroll for free to listen to audio lessons, classroom podcasts and take practice test.
Interactive Audio Lesson
Listen to a student-teacher conversation explaining the topic in a relatable way.
Introduction to Compression of Fine Grained Soil
🔒 Unlock Audio Lesson
Sign up and enroll to listen to this audio lesson

Today, we'll explore the Virgin Compression Curve, which shows how fine-grained soils compress under stress. What's the basic formula we often use to describe this relationship?

Is it related to the void ratio?
Exactly! The voids ratio versus effective stress helps us understand how soils behave under loads. Why is this important to engineers?

It helps predict how much a soil will settle when a structure is placed on it!
Spot on! Remember, the Virgin Compression Curve shows that at lower stress levels, compression is less significant, but as we increase stress, it compresses more. This is key to understanding soil mechanics.
Understanding the Virgin Compression Line
🔒 Unlock Audio Lesson
Sign up and enroll to listen to this audio lesson

Now, let’s focus on the Virgin Compression Line, or the Normal Consolidation Line, which is the BC portion of our curve. Can someone summarize its importance?

It shows that the soil undergoes substantial compression as we load it beyond certain points.

And it helps in defining the point of normal consolidation, right?
Absolutely! Beyond the Virgin Compression Line, soils tend to show reduced compressibility again after unloading. But if reloaded, they experience different behaviors.
What happens if we unload beyond point 'C'?
Good question! Unloading from 'C' leads to the expansion curve CD, where the soil begins to recover slightly through elastic rebound, but permanent strain remains. Let’s keep that in mind as we review hysteresis effects in our next session.
Elastic Rebound and Hysteresis
🔒 Unlock Audio Lesson
Sign up and enroll to listen to this audio lesson
As we delve into hysteresis, can someone explain this phenomenon in our soil curves?
It’s like the difference between the unloading and reloading paths on the graph?
Right! The reloading curve lies above the unloading curve, showing that the soil does not fully return to its original state. Why do we think this happens?
Because some structural changes in the soil are permanent?
Exactly! There’s irreversible deformations that lead to lower compressibility upon reloading. Always remember to look out for hysteresis loops in your assessments!
Introduction & Overview
Read summaries of the section's main ideas at different levels of detail.
Quick Overview
Standard
This section on the Virgin Compression Curve explains the behavior of fine-grained soils under varying effective stress. It details the consolidation process, including the virgin compression line, unloading, reloading, and key phenomena such as permanent strain and hysteresis loops.
Detailed
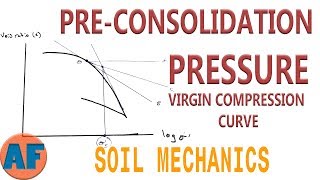
Virgin Compression Curve
The Virgin Compression Curve is a critical aspect of understanding the compressibility of fine-grained soils. This section discusses how the void ratio of a soil sample relates to effective stress through a series of laboratory tests conducted on undisturbed soil samples. The tests involve one-dimensional (1D) consolidation under various pressure increments, where each increment is maintained until equilibrium is achieved.
In the initial loading phase, the soil follows a recompression path (portion AB). However, as effective stress increases, significant compressibility occurs along the Virgin Compression Line (portion BC), also known as the normal consolidation line. After reaching point 'C', if the soil is unloaded, it follows the expansion curve (CD) due to elastic rebound, though permanent strain remains due to the irreversible nature of soil structure.
The loading beyond point 'C' causes the curve to merge into portion EF, indicating reduced compressibility. Furthermore, upon reloading, the observed hysteresis loop between unloading and reloading curves highlights differences in behavior, with reloaded soils exhibiting less compression. This section's significance lies in equipping students with foundational knowledge of soil mechanics essential for future engineering applications.
Youtube Videos


Audio Book
Dive deep into the subject with an immersive audiobook experience.
Virgin Compression Curve Definition
Chapter 1 of 7
🔒 Unlock Audio Chapter
Sign up and enroll to access the full audio experience
Chapter Content
- BC – Virgin compression curve also called normal consolidation line
Detailed Explanation
The Virgin Compression Curve, represented by BC, is a crucial part of the void ratio versus effective stress graph. This curve indicates the relationship where the soil sample is subjected to pressure and experiences compression. This is a specific path that soils take when they are compressed without any prior unloading, essentially showing how the soil behaves under normal consolidation conditions.
Examples & Analogies
Think of a sponge. When you press down on it (applying pressure), it compresses and loses some of its volume. The Virgin Compression Curve is akin to watching how much the sponge compresses under different weights, showing its capacity to adjust and settle under pressure.
Unloading and Expansion Path
Chapter 2 of 7
🔒 Unlock Audio Chapter
Sign up and enroll to access the full audio experience
Chapter Content
- From ‘C’ when the sample is unloaded, sample expands and traces path CD (expansion curve unloading)
Detailed Explanation
When the load on the soil sample is reduced, the sample expands along the path CD. This path represents how the soil behaves during the unloading process and highlights its ability to recover somewhat. However, not all of the deformation is recovered, indicating that some changes to the soil structure may be permanent.
Examples & Analogies
Imagine a balloon that you’ve inflated and then let some air out. The balloon expands back to a larger size; however, it may not return to its original, full size. The expansion curve from point C to D on the graph tells us how much the soil can return when pressure is removed.
Permanent Strain and Elastic Recovery
Chapter 3 of 7
🔒 Unlock Audio Chapter
Sign up and enroll to access the full audio experience
Chapter Content
- Sample undergoes Permanent strain due to irreversible soil structure and there is a small elastic recovery.
Detailed Explanation
Permanent strain refers to the changes in soil structure that remain even after the load is removed. Although some elastic recovery occurs, which allows the soil to revert to its original shape to some extent, the sample will not fully return to its pre-compression state. This aspect is important, as it shows the limitations of soil strength after loading.
Examples & Analogies
Consider a clay sculpture. If you press on it, it may flatten and stretch—a certain amount of that change might be fixed permanently even if you try to mold it back. The permanent strain highlights how some of the soil's character changes under load permanently.
Elastic Rebound and Hysteresis Loop
Chapter 4 of 7
🔒 Unlock Audio Chapter
Sign up and enroll to access the full audio experience
Chapter Content
- The deformation recovered is due to elastic rebound.
Detailed Explanation
Elastic rebound is the process by which a material returns to its original shape after a loading is removed, provided that the material has not exceeded its elastic limit. This rebound effect contributes to the soil’s recovery capacity after unloading and is crucial for understanding the soil’s behavior under changing pressures.
Examples & Analogies
Think of a rubber band. When you stretch it and then let it go, it snaps back to its original shape. The elastic rebound in soil represents this behavior, but remember that if the rubber band is stretched too far, it may not return to its original size completely.
Reloading Curve and Hysteresis Loop
Chapter 5 of 7
🔒 Unlock Audio Chapter
Sign up and enroll to access the full audio experience
Chapter Content
- When the sample is reloaded-reloading curve lies above the rebound curve and makes a hysteresis loop between expansion and reloading curves.
Detailed Explanation
When the soil is reloaded after being unloaded, the reloading curve typically lies above the previous rebound curve. This creates a hysteresis loop, which indicates that the soil behaves differently during reloading compared to when it is unloaded, reflecting changes in its structure and behavior due to previous loading.
Examples & Analogies
Imagine a car tire that has been deflated and then reinflated. The tire does not regain exactly the same pressure or shape it originally had due to changes in the rubber. The hysteresis loop represents this difference in behavior during loading and unloading.
Reduced Compression on Reloading
Chapter 6 of 7
🔒 Unlock Audio Chapter
Sign up and enroll to access the full audio experience
Chapter Content
- The reloaded soils show less compression.
Detailed Explanation
When the soil undergoes reloading after being previously loaded and unloaded, it generally shows less compression compared to the initial loading. This phenomenon occurs because the soil structure has already been altered during the first loading phase, leading to a diminished capacity for subsequent compression.
Examples & Analogies
Consider a sponge that has been squeezed multiple times. Each time it is squeezed, it doesn't compress as much as the first time because its fibers have already been compacted. This illustrates how soil behaves similarly when reloaded after initial compression.
Merging into the EF Segment
Chapter 7 of 7
🔒 Unlock Audio Chapter
Sign up and enroll to access the full audio experience
Chapter Content
- Loading beyond ‘C’ makes the curve merge smoothly into portion EF as if the soil is not unloaded.
Detailed Explanation
As the loading continues beyond point C on the graph, the curve transitions smoothly into segment EF. This suggests that the soil behaves as though it hasn't been unloaded, which can be interpreted as excessive loading leading to a more significant alteration in its structure.
Examples & Analogies
Think of a balloon that, after being inflated and let out, is re-inflated again. If you inflate it beyond a certain point, it behaves consistently with how it has been previously stretched without a visible difference, as if it’s forgotten about the previous releases of air.
Key Concepts
-
Compressibility: The capacity of soil to decrease in volume under stress.
-
Virgin Compression Curve: The graphical representation of the relationship between void ratio and effective stress.
-
Normal Consolidation Line: Path taken by soil under normal consolidation conditions.
-
Hysteresis Loop: The difference between the unloading and reloading curves indicating energy loss.
Examples & Applications
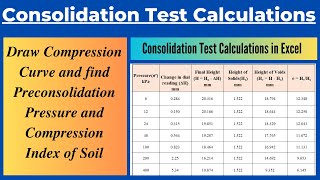
Example 1: A soil being loaded at 100 kPa shows minimal compression initially but when pressure is increased to 300 kPa, the void ratio decreases significantly along the virgin compression line.
Example 2: On unloading from a compression point, a soil sample may expand slightly but retains some deformation due to its unique structural characteristics.
Memory Aids
Interactive tools to help you remember key concepts
Rhymes
When the stress is light, soils compress not tight; as stress grows tall, it's the virgin curve we recall.
Stories
Imagine a sponge in water; when you squeeze it gently, it recovers. But if you press hard and fast, some water remains trapped, just like soil after heavy loading.
Memory Tools
Remember 'CVE' for understanding compression: Compressibility, Virgin Curve, Elastic recovery.
Acronyms
Use 'SURE' to remember
Soil Under Recompression Expands.
Flash Cards
Glossary
- Virgin Compression Curve
The curve that represents the relationship between void ratio and effective stress during the consolidation of fine-grained soils.
- Effective Stress
The stress that contributes to soil strength and is responsible for the compressibility of the soil.
- Void Ratio
The ratio of the volume of voids to the volume of solid particles in a soil mass.
- Normal Consolidation Line
Another term for the Virgin Compression Line, representing the path of a soil under normal loading conditions.
- Elastic Rebound
The recovery of a soil sample when the applied load is removed, resulting from elastic deformation.
- Permanent Strain
Strain that remains in the soil even after the removal of applied stress due to irreversible changes in soil structure.
Reference links
Supplementary resources to enhance your learning experience.