
Recompression and Compression Curves
Enroll to start learning
You’ve not yet enrolled in this course. Please enroll for free to listen to audio lessons, classroom podcasts and take practice test.
Interactive Audio Lesson
Listen to a student-teacher conversation explaining the topic in a relatable way.
Introduction to Compression Curves
🔒 Unlock Audio Lesson
Sign up and enroll to listen to this audio lesson

Today, we're going to explore how we analyze the compressibility of fine-grained soils using compression curves. Can anyone define what we mean by 'voids ratio'?

It's the ratio of the volume of voids to the volume of solids in the soil.
Exactly! And how does this relate to effective stress?

Effective stress is the stress that contributes to soil strength. It's calculated by subtracting pore water pressure from total stress.
Correct! Now, when we plot this relationship, what do we often observe?

We can see a curve showing how soil compresses under different stress increments!
Great observation! Remember that as effective stress increases, the soil compresses more significantly. This is critical for understanding soil stability.
Understanding the Virgin Compression Curve
🔒 Unlock Audio Lesson
Sign up and enroll to listen to this audio lesson

Now let's discuss the virgin compression curve. Who can explain what this curve represents?

It's the portion of the graph beyond the initial compression path where the soil undergoes much greater compression!
Exactly! It shows where the soil transitions from recompressed structure to its virgin state. Why is this transition important?
It helps engineers design structures since they need to know how much the ground will compress under the weight.
Absolutely! And remember, compression curves can be shown in both arithmetic and logarithmic plots. Knowing when to apply each plot is part of mastering this material.
Unloading and Reloading Paths
🔒 Unlock Audio Lesson
Sign up and enroll to listen to this audio lesson
Let's talk about what happens when the soil is unloaded. What do you understand about the expansion curve?
The soil expands along path CD after unloading, which indicates recovery, but there's some permanent strain too.
Correct! So when we apply a load again, how does the path change?
The reloading path lies above the unloading path, forming a hysteresis loop.
That's right! This hysteresis is key because it shows soils can react differently when stress is reapplied compared to when the stress is initially applied.
Integrative Compression and Soil Behavior
🔒 Unlock Audio Lesson
Sign up and enroll to listen to this audio lesson
Now, let's summarize how the loading beyond point 'C' behaves. What happens when we load the soil too much?
The compression curve merges smoothly into another portion as if the soil wasn't unloaded at all.
Good! This suggests that the soil doesn't completely revert back to its original state after unloading, which is vital for engineering assessments.
It highlights how important it is to understand these curves for predicting soil behavior.
Exactly! Remember, comprehending these principles is essential for maintaining the integrity of engineering structures built on fine-grained soils.
Introduction & Overview
Read summaries of the section's main ideas at different levels of detail.
Quick Overview
Standard
The compressibility of fine-grained soils is discussed through laboratory methods that analyze void ratio versus effective stress. Key topics include the virgin compression line, reloading effects, and the relationship between uncoupled loading and unloading paths represented through graphical curves.
Detailed
Recompression and Compression Curves
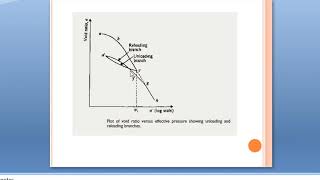
The compressibility of fine-grained soils is critical for understanding soil behavior under load. In laboratory tests, a soil specimen is subjected to 1D consolidation to measure how void ratio changes with effective stress. Key points include:
- Void Ratio vs. Effective Stress Plot: The relationship is often displayed in a 2D plot, revealing how soils react under varying pressures.
- Recompression Path (AB): At lower effective stresses, soils experience less compression.
- Virgin Compression Curve (BC): Beyond a certain point, known as the virgin compression line, soils undergo significant compression.
- Unloading and Reloading Behavior: When unloaded, the soil slightly expands along path CD, exhibiting permanent strain and minor elastic recovery. Upon reloading, the path is above the unloading curve, forming a hysteresis loop.
- Integrative Compression: Compression beyond certain points blends curves and indicates that soil behavior under sustained loads can appear independent of prior unloading.
The importance of understanding these behaviors lies in their application to real-world engineering projects, where managing soil stability and structural integrity is crucial.
Youtube Videos


Audio Book
Dive deep into the subject with an immersive audiobook experience.
Introduction to Compression Behavior
Chapter 1 of 8
🔒 Unlock Audio Chapter
Sign up and enroll to access the full audio experience
Chapter Content
The compressibility of fine grained soils can be described in terms of voids ratio versus effective stress.
Detailed Explanation
Compressibility refers to how much a soil will compress under load. In finer-grained soils, this behavior can be analyzed using the relationship between the voids ratio (the ratio of the volume of voids to the volume of solids in a soil sample) and effective stress (the stress carried by the soil skeleton). This relationship helps us understand how the soil will behave under different loads.
Examples & Analogies
Imagine a sponge. When you press it, the air pockets inside (voids) compress, and the sponge becomes denser. As you release the pressure, some of the air may return, but not all. Similarly, fine-grained soils react to loads in a particular way that can be captured in a graph, allowing engineers to predict how much the soil will settle.
One-Dimensional Consolidation Testing
Chapter 2 of 8
🔒 Unlock Audio Chapter
Sign up and enroll to access the full audio experience
Chapter Content
A laboratory soil specimen of dia 60mm and height 20mm is extracted from the undisturbed soil sample obtained from the field. This sample is subjected to 1D consolidation in the lab under various pressure increments. Each pressure increment is maintained for 24 hrs and equilibrium void ratio is recorded before the application of the next pressure increment.
Detailed Explanation
To assess how a soil sample consolidates under pressure, a specific size specimen (60mm in diameter and 20mm high) is taken from its natural environment. In the lab, the sample is subjected to incremental loads, with each load applied for 24 hours to allow the soil to stabilize. The void ratio is measured after each load to track how the soil compresses.
Examples & Analogies
Think of this process like a slow game of 'musical chairs.' Each round (pressure increment) lasts for a specific time, and players (soil particles) slowly settle down. By observing how the players (particles) adjust after each round, we can learn about their behaviors under stress.
Compression Paths and Curves
Chapter 3 of 8
🔒 Unlock Audio Chapter
Sign up and enroll to access the full audio experience
Chapter Content
When the sample is recompressed from point D it follows DE and beyond C it merges along BCF and it compresses as it moves along BCF.
Detailed Explanation
The testing results in a graph showing different paths of compression. When the soil is recompressed from a certain point, it follows a specific path (DE). Once it reaches point C, the graph shows that beyond this point, the behavior of the soil changes to a new compression path (BCF), indicating a different state of compressibility.
Examples & Analogies
Imagine a bouncy ball. When you press it slightly (recompression), it returns to its original shape somewhat. If you press it harder (moving beyond point C), it gets squished into a new shape that it won't return from completely, similar to how soil behaves under increasing loads.
Virgin Compression Curve
Chapter 4 of 8
🔒 Unlock Audio Chapter
Sign up and enroll to access the full audio experience
Chapter Content
This is the virgin compression line (portion BC) also called the normal compression line and the sample undergoes large compression.
Detailed Explanation
The Virgin Compression Curve indicates the behavior of a soil sample when it is compressed for the first time without any prior loading. This line shows significant compression as the effective stress increases, reflecting the soil's tendency to compact under load.
Examples & Analogies
Think of a vacuum-sealed bag of chips. When you first seal it (virgin compression), the chips compress significantly as the air is sucked out. This is akin to how soil behaves initially when subjected to loads.
Expansion and Unloading
Chapter 5 of 8
🔒 Unlock Audio Chapter
Sign up and enroll to access the full audio experience
Chapter Content
From ‘C’ when the sample is unloaded, sample expands and traces path CD (expansion curve unloading).
Detailed Explanation
When the applied load on the soil sample is removed after reaching point C, the sample begins to expand again. This expansion follows a specific path (CD) that traces the soil's recovery behavior after unloading. However, not all deformation is recovered due to the nature of the soil structure.
Examples & Analogies
Consider a spring. When you stretch it, it compresses. When you let go, it partially returns to its original shape, but not perfectly. This is similar to the soil's behavior after the load is removed, recovering to some extent but remaining altered.
Permanent Strain and Elastic Rebound
Chapter 6 of 8
🔒 Unlock Audio Chapter
Sign up and enroll to access the full audio experience
Chapter Content
Sample undergoes Permanent strain due to irreversible soil structure and there is a small elastic recovery.
Detailed Explanation
Permanent strain refers to the deformation that remains in the soil after unloading. While there is some elastic recovery (the ability to return to its original shape), a portion of the deformation becomes permanent due to the soil's structure being altered under load.
Examples & Analogies
Imagine a playdough sculpture. When you shape it (load it), it forms into a new shape. When you stop pressing (unload), it returns to a different shape that is not exactly like the original. This exemplifies how soil can retain some of their deformation permanently.
Reloading Behavior
Chapter 7 of 8
🔒 Unlock Audio Chapter
Sign up and enroll to access the full audio experience
Chapter Content
When the sample is reloaded, the reloading curve lies above the rebound curve and makes a hysteresis loop between expansion and reloading curves.
Detailed Explanation
When the soil sample is subjected to reloading after unloading, the path it takes on the graph is different from the initial compression path. The loading path lies above the previous rebound curve, creating a hysteresis loop, which indicates that the soil behaves differently upon reloading compared to when it was first loaded.
Examples & Analogies
Think of riding a bike. The first time you ride it down a hill (initial load), you gain speed (compression). If you stop and try to ride back up (unloading), you may use more energy than the first run. This difference illustrates the varied behavior under different loading scenarios.
Final Compression Behavior
Chapter 8 of 8
🔒 Unlock Audio Chapter
Sign up and enroll to access the full audio experience
Chapter Content
Loading beyond ‘C’ makes the curve to merge smoothly into portion EF as if the soil is not unloaded.
Detailed Explanation
When the loading continues beyond point C on the compression curve, the graph shows a smooth transition into another portion (EF), indicating that the soil behaves as if it had never been unloaded. This reflects the soil's ability to bear additional loads without a significant drop in compressibility.
Examples & Analogies
Imagine stacking books on a thin table. If you remove a few and then add more (like unloading and reloading), the table might still hold them without collapsing completely. This illustrates how soil continues to support weight even after some unloading.
Key Concepts
-
Compressibility: How a soil's volume changes under stress.
-
Void Ratio: Measurement expressing voids vs. solids.
-
Effective Stress: The part of the total stress contributing to structural stability.
-
Virgin Compression Curve: Indicates where significant compression begins.
-
Hysteresis Loop: Describes different behaviors in loading versus unloading.
Examples & Applications
In a compaction test, a soil sample is compressed, demonstrating the transition from recompression to virgin compression.
When observing the behavior during a p.y.c.t. (pressure yield compression test), it was noted that unloading and reloading effects caused notable deviations in the hysteresis loop showing residual stresses.
Memory Aids
Interactive tools to help you remember key concepts
Rhymes
Soil compressible, acting under stress, find the curves that show us best.
Stories
Imagine a land chef baking a cake. The batter expands under pressure and adjusts itself when cooled back down; this is how soil behaves during compression and recompression!
Memory Tools
C-V-H: remember Compressibility, Void Ratio, and Hysteresis to navigate soil behaviors.
Acronyms
H.E.C.
Hysteresis
Expansion
Compression defines soil's dance under loads.
Flash Cards
Glossary
- Compressibility
The ability of a material to decrease in volume in response to an applied stress.
- Void Ratio
The ratio of the volume of voids in a soil to the volume of solids.
- Effective Stress
The stress carried by the soil skeleton that contributes to soil strength.
- Virgin Compression Curve
The portion of the compression curve beyond initial compression representing significant soil compression.
- Hysteresis Loop
The closed path formed in a stress-strain curve depicting the difference in behavior during loading and unloading.
Reference links
Supplementary resources to enhance your learning experience.