
The basis for this method is the theoretical (Uz) versus log Tv curve and experimental dial gauge reading and log t curves are similar.
Enroll to start learning
You’ve not yet enrolled in this course. Please enroll for free to listen to audio lessons, classroom podcasts and take practice test.
Interactive Audio Lesson
Listen to a student-teacher conversation explaining the topic in a relatable way.
Introduction to Coefficient of Consolidation (Cv)
🔒 Unlock Audio Lesson
Sign up and enroll to listen to this audio lesson

Today, we are going to learn about the coefficient of consolidation, or Cv, which is important for understanding soil behavior under load. Does anyone know what consolidation means?

Is it about how soil allows water to move and change shape?
Exactly! Consolidation refers to the process where soil decreases in volume due to the expulsion of water from its pores. It's crucial for engineering applications. Remember the acronym 'C.V.' for Consolidation Volume.

How do we actually measure Cv?
Good question! We can use several graphical methods. Today we'll focus on the Log-time method.
Steps of the Log-time Curve Fitting Method
🔒 Unlock Audio Lesson
Sign up and enroll to listen to this audio lesson

Let's go through the steps of the Log-time curve fitting method. First, we plot dial readings of compression against time on a logarithmic scale. Who can explain what logging means?

Logging means using logarithmic scales which help in visualizing exponential data better!
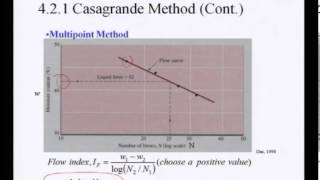
That's right! Once we plot our data, we will identify two points, P and Q, on the curve corresponding to times t1 and t2, where t2 is four times t1.

What do we do after that?
Next, we find the difference in dial readings, label it as x, and plot point R. Then we draw a line to find the 0% consolidation level, represented as d0.
Understanding the Interpretation of Curves
🔒 Unlock Audio Lesson
Sign up and enroll to listen to this audio lesson
Now that we've plotted the curves, how do we interpret them to find the total consolidation?
We connect the straight portion to the hyperbola?
Correct! By projecting the lines of the primary and secondary consolidation, we can find the intersection point T which represents 100% consolidation.
Does this mean we can determine how long consolidation may take?
Absolutely! Understanding these curves helps predict how different soils react under load over time.
Introduction & Overview
Read summaries of the section's main ideas at different levels of detail.
Quick Overview
Standard
The section elaborates on various methods to calculate the coefficient of consolidation (Cv), focusing on the Log-time curve fitting method, and outlines step-by-step instructions to plot and analyze the consolidation curves for accurate readings.
Detailed
Determination of Coefficient of Consolidation (Cv)
In this section, we explore the methodology for determining the coefficient of consolidation (Cv) using laboratory data. Specifically, we focus on the Log-time curve fitting method, which compares theoretical curves against experimental dial gauge readings. The key steps involve plotting the dial readings of compression against time on a logarithmic scale and utilizing given time points to create a visualization of the consolidation process, helping identify specific consolidation percentages.
Youtube Videos


![Basic Geotechnical Engineering [ 15cv45]](https://img.youtube.com/vi/JcLtXblqqGg/mqdefault.jpg)

Audio Book
Dive deep into the subject with an immersive audiobook experience.
Overview of Log-Time Curve Fitting Method
Chapter 1 of 2
🔒 Unlock Audio Chapter
Sign up and enroll to access the full audio experience
Chapter Content
The basis for this method is the theoretical (Uz) versus log Tv curve and experimental dial gauge reading and log t curves are similar.
Detailed Explanation
This method compares two types of curves: the theoretical log Tv curve and the experimental dial gauge reading log t curve. Both curves are used to assess how soils consolidate over time under pressure. The theoretical curve helps to predict the ideal behavior, while the experimental curve represents actual measurements taken during tests.
Examples & Analogies
Imagine you are following a recipe for baking a cake. The theoretical recipe provides all the steps and times for each baking phase (theoretical curve), but when you actually bake the cake, you note how it rises and cooks in your specific oven (experimental curve). Comparing both gives you insight into how closely reality matches the ideal.
Importance of Comparison
Chapter 2 of 2
🔒 Unlock Audio Chapter
Sign up and enroll to access the full audio experience
Chapter Content
The theoretical (Uz) versus log Tv curve and experimental dial gauge reading and log t curves are similar.
Detailed Explanation
The similarity between these curves allows engineers to validate their theoretical models against real-world measurements. It ensures that the predictions made about soil consolidation during laboratory tests are accurate, which is crucial for civil engineering projects.
Examples & Analogies
Think of a weather forecast. The predictions (theoretical model) often guide what to expect, but actual weather patterns (experimental data) show how accurate those predictions were over time. If the forecast closely matches reality, it builds confidence in the forecasting method.
Key Concepts
-
Log-Time Method: A technique to visualize and measure consolidation rates using logarithmic scaling.
-
Dial Gauge Readings: Measurements that help track soil compression over time during laboratory experiments.
Examples & Applications
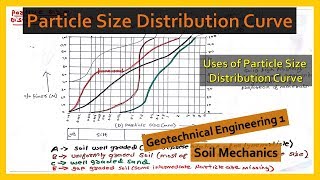
An example would be plotting the compression dial readings of a clay sample over time during a consolidation test.
Memory Aids
Interactive tools to help you remember key concepts
Rhymes
Cv helps soil behave,
Stories
Imagine planting a tree in soft soil: as the tree grows, the soil compresses. You watch how fast the soil settles under the weight.
Memory Tools
D-R-T: Dial readings – Rise on the curve – Time in log scale.
Acronyms
C.V. - Consolidation's Very important!
Flash Cards
Glossary
- Coefficient of Consolidation (Cv)
A parameter that indicates the rate at which soil consolidates under load.
- Logtime method
A graphical method for determining consolidation through logarithmic time plots.
- Dial gauge
An instrument used to measure small distances or displacements.
Reference links
Supplementary resources to enhance your learning experience.