
Consistency of Rainfall Records
Enroll to start learning
You’ve not yet enrolled in this course. Please enroll for free to listen to audio lessons, classroom podcasts and take practice test.
Interactive Audio Lesson
Listen to a student-teacher conversation explaining the topic in a relatable way.
Importance of Consistency in Rainfall Records
🔒 Unlock Audio Lesson
Sign up and enroll to listen to this audio lesson

Today, we're discussing the importance of consistency in rainfall records. Can anyone tell me why accurate rainfall data is so critical for hydrological studies?

I think it’s important because we need reliable data to make sure our calculations and designs are correct.
Exactly, Student_1! Inaccurate data can mislead our results. We rely on historical rainfall records to design various infrastructures like dams and drainage systems. If those records are inconsistent, it can lead to serious problems.

What kinds of problems are we talking about?
Great question, Student_2! For example, we may underestimate flooding risks or overestimate water resource availability, which could lead to disastrous consequences for affected areas.

That sounds serious. So how do we even test for inconsistencies in these records?
We will learn about methods like the Double Mass Curve technique in our next session. To recap today, consistency in rainfall records is essential for accurate hydrological studies, reliable infrastructure, and effective water resource management.
Causes of Inconsistencies in Rainfall Data
🔒 Unlock Audio Lesson
Sign up and enroll to listen to this audio lesson

Let's dive into the causes of inconsistencies in rainfall data. What are some things that could lead to this?

I think if the rain gauge is moved to a different location, like from open field to forested area, that could change how much rain is collected.
Spot on, Student_4! That’s a classic example. Other factors can include changes in observation techniques or obstructions caused by buildings. Urbanization also alters local microclimates, which can affect rainfall measurements.
What do you mean by urbanization changing microclimates?
Good observation, Student_1. Urbanization can create heat islands, impacting rainfall patterns and leading to potential discrepancies in data.
Got it! So how do we keep track of these changes?
That’s where maintaining metadata comes into play, along with periodic reviews of the data. Consistency checks help us validate our records.
Methods for Checking Consistency
🔒 Unlock Audio Lesson
Sign up and enroll to listen to this audio lesson
Now, let’s talk about methods we use to check for consistency in rainfall data. Who can remind me of one common method?
The Double Mass Curve method!
Correct! The Double Mass Curve compares the cumulative rainfall of a station against that of nearby stations. What would a straight line in this plot indicate?
It means that the records are consistent!
Exactly. If you see a change in slope, it indicates potential inconsistencies. Can anyone tell me why this method might have limitations?
It needs data from multiple nearby stations, and if they’re inconsistent too, it doesn’t really help.
Well said! We also have statistical tests like the Standard Normal Homogeneity Test and Pettitt's Test that help detect inconsistencies. These allow us to perform a more detailed statistical analysis on rainfall data.
Correcting Inconsistent Records
🔒 Unlock Audio Lesson
Sign up and enroll to listen to this audio lesson
Last session, we learned methods for checking consistency. Once we've identified inconsistencies, what do we do next?
We need to correct the data!
Yes! There are different methods for correction. Who remembers one method we discussed?
The Ratio Method, where you adjust using slope ratios from the Double Mass Curve!
Indeed! And another technique is the Linear Regression Method, which helps derive a correction equation based on relationships between stations. Why is this crucial in engineering applications?
If we correct the data, then the infrastructure we create will be safer and more reliable!
Exactly, Student_2! Ensuring reliable data ultimately leads to better decision-making in water resource management.
Introduction & Overview
Read summaries of the section's main ideas at different levels of detail.
Quick Overview
Standard
The consistency of rainfall records is crucial for accurate hydrological analyses and designing water infrastructures. This section examines the importance of consistent data, causes of data inconsistencies, methods for evaluating consistency, correcting records, and best practices in managing rainfall data.
Detailed
Consistency of Rainfall Records
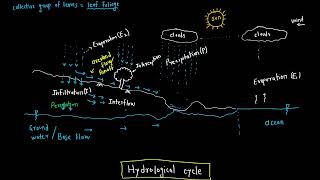
Rainfall data is a key element in hydrological studies, yet its reliability hinges on the consistency of the records over time. Inconsistencies arise due to various factors such as relocation of rain gauge stations, changes in observation techniques, and urbanization effects. Before utilizing rainfall data for hydrological modeling and infrastructure design, it's vital to assess and ensure the consistency of records.
Importance of Consistency
- Accuracy in Hydrological Studies: Inconsistent records can lead to erroneous conclusions in hydrological designs.
- Infrastructure Design Reliability: Reliable rainfall data is essential for the design of civil engineering projects like reservoirs and flood management systems.
- Assessment of Climate Trends: Inconsistencies can misrepresent climatic changes.
- Decision Making in Water Resource Management: Dependable data is critical for effective water management strategies.
Causes of Inconsistencies
Factors include: relocation of gauge stations, changes in observation methods, obstruction by buildings/vegetation, urbanization, instrumental changes, and human errors.
Methods for Checking Consistency
- Double Mass Curve Method (DMC): A graphical approach to determine the consistency by plotting cumulative rainfall data against neighboring stations.
- Homogeneity Testing: Statistical tests like SNHT, Pettitt’s Test, and Buishand’s Range Test help identify changes in data consistency.
Correcting Inconsistent Records
Correction methods include the Ratio Method and Linear Regression Method to adjust for inconsistencies identified.
Application in Engineering
Consistency checks are crucial for design flood estimation, reservoir operations, urban hydrology, and climate change research.
Best Practices
Maintaining metadata, periodic reviews, cross-checking data sources, and using automation can significantly enhance data reliability.
Youtube Videos


Audio Book
Dive deep into the subject with an immersive audiobook experience.
Introduction to Rainfall Data
Chapter 1 of 9
🔒 Unlock Audio Chapter
Sign up and enroll to access the full audio experience
Chapter Content
Rainfall data is a fundamental input in hydrological analysis and water resources engineering. However, the reliability of this data is critical, especially when it is collected over long durations and used for designing water infrastructure such as dams, culverts, canals, and urban drainage systems.
Detailed Explanation
This chunk introduces the importance of rainfall data within hydrological studies and water resources engineering. Rainfall data is crucial because it helps engineers and scientists understand water flow, manage resources, and design essential infrastructure. The data's reliability becomes even more important when it's used to make long-term decisions, such as constructing dams or drainage systems, which directly affect communities.
Examples & Analogies
Think of rainfall data like the information a meteorologist uses to predict the weather. Just as the accuracy of a forecast affects how we prepare for a storm, reliable rainfall data is necessary for engineers designing systems that manage water—like ensuring a dam can hold back the right amount of water during heavy rains.
Why Consistency Matters
Chapter 2 of 9
🔒 Unlock Audio Chapter
Sign up and enroll to access the full audio experience
Chapter Content
Changes in the surroundings of a rain gauge station — like urbanization, relocation of the station, instrumentation errors, or land use changes — may introduce inconsistencies in the rainfall records. Therefore, testing the consistency of rainfall records becomes essential before utilizing them in design or hydrologic modeling.
Detailed Explanation
Here, we discuss factors that can affect the accuracy of rainfall data. For instance, if a rain gauge is moved from an open area to a city, its readings can change due to the urban heat island effect or buildings blocking rainfall. These inconsistencies can mislead hydrologists and engineers when they analyze historical data or build models. Hence, it’s critical to test rainfall records for consistency before making any significant decisions based on that data.
Examples & Analogies
Imagine you're baking a cake, but halfway through, you realize you've moved the oven to a different room where the temperature is much cooler. Your cake's outcome will be inconsistent with previous bakes. Similarly, changes around a rain gauge can affect rainfall measurements, leading to unreliable data.
Consequences of Inconsistent Records
Chapter 3 of 9
🔒 Unlock Audio Chapter
Sign up and enroll to access the full audio experience
Chapter Content
• Accuracy in Hydrological Studies: Hydrologic designs depend on historical data. Inconsistencies may mislead results.
• Infrastructure Design Reliability: Civil engineering projects like reservoirs or stormwater systems rely on consistent rainfall data.
• Assessment of Climate Trends: Inconsistent records can distort conclusions about climatic trends or changes.
• Decision Making in Water Resource Management: Planning of irrigation, flood control, and water supply systems demand dependable data.
Detailed Explanation
This portion emphasizes the serious implications of using inconsistent rainfall data. Inaccuracies can lead to flawed hydrological studies, which affect engineers' designs for infrastructure like reservoirs and drainage systems. Additionally, mishandled data can alter our understanding of climate trends and misguide essential decisions related to water management.
Examples & Analogies
Consider a scenario where inconsistent rainfall records lead a city to underestimate flood risks, prompting them to construct a smaller drainage system than needed. When heavy rains occur, the drainage may fail, causing flooding. Just like planning a trip without accurate gas mileage data can leave you stranded, failed water management due to inconsistent records can have disastrous consequences.
Causes of Inconsistencies
Chapter 4 of 9
🔒 Unlock Audio Chapter
Sign up and enroll to access the full audio experience
Chapter Content
Rainfall records might become inconsistent due to:
• Relocation of Rain Gauge Station: A move from an open field to a forested area or vice versa affects measurements.
• Change in Observation Techniques: Manual to automatic gauge changes can create discrepancies.
• Obstruction by Buildings or Vegetation: Can alter wind flow and rain capture.
• Urbanization Effects: Change in local microclimate due to development.
• Instrumental Changes: Replacement or calibration error of the rain gauge.
• Human Errors: Inaccurate observations or recording mistakes.
Detailed Explanation
This chunk lists various reasons why rainfall data can become inconsistent. Every factor, from the physical location of the rain gauge to the method used to record data, can alter the final data set. For instance, if a rain gauge is moved closer to tall buildings, nearby structures might block wind, which can influence how much rain the gauge captures.
Examples & Analogies
Imagine trying to measure the amount of water falling in your backyard, but you have a large tree blocking some rain. If you move your rain gauge to a more open area, your readings will change due to the new conditions. This scenario reflects how environmental changes can impact the consistency of rainfall measurements.
Statistical Methods for Consistency Checking
Chapter 5 of 9
🔒 Unlock Audio Chapter
Sign up and enroll to access the full audio experience
Chapter Content
There are several statistical and graphical methods to evaluate the consistency of rainfall data: ... (details of these methods follow).
Detailed Explanation
In this section, various methods for checking the reliability of rainfall data are introduced. These methods, both statistical and graphical, are used to identify any inconsistencies over time in the data collected. By employing these methods, researchers can determine whether detected deviations are significant or just random fluctuations.
Examples & Analogies
Think of these methods as tools in a toolbox. Just like how you would pick the right tool to fix a car depending on the problem—be it a wrench for tightening bolts or a screwdriver for screws—engineers and hydrologists use different methods for analyzing rainfall data to ensure that their projects are based on solid data.
Correcting Inconsistent Records
Chapter 6 of 9
🔒 Unlock Audio Chapter
Sign up and enroll to access the full audio experience
Chapter Content
After identifying the inconsistency, corrections can be made using: ... (details of correction methods follow).
Detailed Explanation
This section discusses methods for correcting identified inconsistencies in rainfall records. When problems are detected, appropriate techniques are employed to ensure the data used is as accurate as possible for future planning and analysis.
Examples & Analogies
Consider a student who realizes they made calculation errors in their math assignment. To correct it, the student goes back, reviews their work for mistakes, and adjusts their answers before submitting. Similarly, hydrologists must go back to rainfall records to fix inaccuracies based on established correction methods.
Usage in Engineering Applications
Chapter 7 of 9
🔒 Unlock Audio Chapter
Sign up and enroll to access the full audio experience
Chapter Content
• Design Flood Estimation: Inconsistent data can underestimate or overestimate flood magnitudes.
• Reservoir Operation Studies: Reliability depends on historical rainfall input.
• Urban Hydrology: Design of drainage systems needs accurate intensity-duration-frequency (IDF) curves.
• Climate Change Research: Long-term studies need homogenized data for validity.
Detailed Explanation
This chunk outlines various practical applications of consistent rainfall records in engineering. Each application relies on the accuracy of rainfall data—whether it’s designing flood management systems, reservoir operations, drainage system design, or conducting research on climate change. Therefore, consistent data is essential across all these fields.
Examples & Analogies
Just as car mechanics rely on a well-calibrated tool to ensure that repairs are made properly, engineers rely on accurate rainfall data to create reliable infrastructure. If the data is faulty, the systems built may not perform as expected, similar to how a car might break down if fixed with faulty gear.
Case Study Example
Chapter 8 of 9
🔒 Unlock Audio Chapter
Sign up and enroll to access the full audio experience
Chapter Content
Suppose a rain gauge at Station A shows a sudden increase in rainfall after 1990, compared to its past trend and neighboring stations. Steps: ... (details follow).
Detailed Explanation
This section walks through a hypothetical case study where a sudden shift in rainfall data raises concerns about consistency. Through a series of steps, one can analyze the data for adjustments. The process highlights the importance of ensuring that changes in the data are understood and corrected before relying on it.
Examples & Analogies
Think of this case study as a detective unraveling a mystery. Just like a detective would gather evidence, analyze clues, and follow leads to solve a case, engineers gather data, discover inconsistencies, and correct them to ensure they are making decisions based on reliable information.
Best Practices in Rainfall Data Management
Chapter 9 of 9
🔒 Unlock Audio Chapter
Sign up and enroll to access the full audio experience
Chapter Content
• Maintain Metadata: Record all station changes, calibration logs, and surroundings.
• Periodic Review: Conduct consistency checks at regular intervals.
• Cross-checking: Validate data with satellite or radar sources when possible.
• Use of Automation: Minimize manual errors by switching to digital gauges.
Detailed Explanation
This section presents best practices for managing rainfall data effectively. It emphasizes maintaining detailed records, regularly checking the data for consistency, and using modern technology to enhance accuracy. By implementing these practices, organizations can greatly improve the reliability of their data.
Examples & Analogies
Consider a chef who keeps a meticulous log of their recipes, ingredients, and techniques. By regularly reviewing the log and adjusting based on what works best, they ensure that every dish comes out perfectly every time. Similarly, consistent practices in rainfall data management lead to improved accuracy and reliability in hydrological studies.
Key Concepts
-
Double Mass Curve: A graphical method to check rainfall data consistency.
-
Inconsistencies: Errors or changes in data recording that can affect analysis.
-
Statistical Testing: Methods used to evaluate the consistency and homogeneity of rainfall records.
Examples & Applications
A rain gauge at Station A shows an increase in rainfall after 1990, necessitating a review using Double Mass Curve.
Using Linear Regression to adjust rainfall data based on observed correlations with nearby stations.
Memory Aids
Interactive tools to help you remember key concepts
Rhymes
When rain gauge moves a lot, data can go awry, / For consistent records keep the truth nearby.
Stories
Imagine a town that builds a dam based on old rain data. Suddenly, they realize their design was flawed because the rain gauge was moved. This lesson taught them to always check data consistency before constructing infrastructure.
Memory Tools
To remember the causes of inconsistency, think: R-Change (Relocation, Change in techniques, Obstruction, Human error, Urbanization).
Acronyms
Use HATS for Homogeneity
- Homogeneity
- Analysis
- Testing
- Statistical methods.
Flash Cards
Glossary
- Double Mass Curve (DMC)
A method used to check the consistency of rainfall data by plotting cumulative rainfall against neighboring stations.
- Homogeneity Testing
Statistical tests used to identify inconsistencies in historical data.
- Standard Normal Homogeneity Test (SNHT)
A statistical test that detects changes in the mean of rainfall data by converting them into standard normal variates.
- Pettitt’s Test
A non-parametric test identifying single change-points in time series data.
- Rain Gauge
An instrument used to measure the amount of rainfall.
- Inconsistency
Discrepancies in data that can arise from errors, changes in technique, or external factors.
Reference links
Supplementary resources to enhance your learning experience.