
Methods for Checking Consistency
Enroll to start learning
You’ve not yet enrolled in this course. Please enroll for free to listen to audio lessons, classroom podcasts and take practice test.
Interactive Audio Lesson
Listen to a student-teacher conversation explaining the topic in a relatable way.
Double Mass Curve Method
🔒 Unlock Audio Lesson
Sign up and enroll to listen to this audio lesson

Today, we'll learn about the Double Mass Curve method, the most commonly used technique for checking consistency in rainfall records. Can anyone explain why we would want to check for consistency?

We want to ensure that our rainfall data is accurate for hydrological studies!
Correct! Inaccurate data can lead to poor decisions in projects like reservoirs and drainage systems. Now, who can describe the basic procedure of the DMC method?

You plot the cumulative rainfall of the station versus neighboring stations, right?
Exactly! A straight line on the graph indicates consistency, while changes in slope suggest inconsistencies. Remember our acronym DMC to keep this method in mind!

What happens if we find an inconsistency? How do we correct it?
Good question! We identify the change point, compute a correction factor, and adjust the values accordingly. Let's summarize: DMC is simple and effective but needs neighboring data. Everyone clear?
Statistical Homogeneity Tests
🔒 Unlock Audio Lesson
Sign up and enroll to listen to this audio lesson

We have another important aspect to cover, which involves statistical tests like the Standard Normal Homogeneity Test. Who knows what this test does?

It changes the data into standard normal variates and checks the means for inconsistencies.
Correct! It alerts us if there's a significant deviation in means. How about Pettitt’s Test?
Isn’t that a non-parametric test that detects one change-point?
Exactly! It's especially useful when changes are abrupt rather than gradual. Now, let’s summarize: SNHT and Pettitt’s Test are crucial for consistent rainfall data.
Limitations and Best Practices of Methods
🔒 Unlock Audio Lesson
Sign up and enroll to listen to this audio lesson
We've discussed several methods. Who can tell me about the limitations of the DMC method?
It requires multiple neighboring stations, which might also have inconsistencies!
Good observation! Now, let’s talk about best practices. What should we do regularly to maintain data accuracy?
We should conduct periodic reviews and check for data consistency.
Absolutely! Regular checks and maintaining accurate metadata are essential. Let’s summarize: DMC needs neighboring data, be cautious of local inconsistencies.
Introduction & Overview
Read summaries of the section's main ideas at different levels of detail.
Quick Overview
Standard
The section outlines key methods for evaluating rainfall data consistency, including the Double Mass Curve (DMC) technique, Standard Normal Homogeneity Test (SNHT), Pettitt's Test, and Buishand’s Range Test. Each method is evaluated for its procedures, advantages, limitations, and applications in ensuring reliable hydrological data.
Detailed
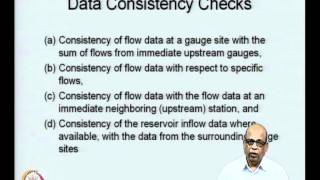
Methods for Checking Consistency
In hydrological studies, ensuring the consistency of rainfall records is crucial for the accuracy of water resource management and infrastructure design. Various methods exist to assess the consistency of these records:
1. Double Mass Curve (DMC) Method
- Procedure: This involves selecting the station of interest and 4–6 neighboring stations with overlapping data. Cumulative rainfall data is plotted, revealing potential inconsistencies if the graph deviates from a straight line.
- Adjustment: If inconsistencies are identified, a correction factor is computed, allowing for adjustments to the rainfall values.
- Advantages: Simple and effective at identifying inconsistencies.
- Limitations: Requires multiple neighboring stations, which might also be inconsistent.
2. Homogeneity Testing
- Standard Normal Homogeneity Test (SNHT): Converts data to standard normal variates to detect changes in means, indicating inconsistencies.
- Pettitt’s Test: A non-parametric method identifying single change-points in time series, effective for sudden shifts.
- Buishand’s Range Test: Analyzes shifts in the means of rainfall data, assuming a normal distribution.
These methods are vital for ensuring the reliability of rainfall data used in various engineering applications, including climate studies and urban planning.
Youtube Videos


Audio Book
Dive deep into the subject with an immersive audiobook experience.
Double Mass Curve Method Overview
Chapter 1 of 4
🔒 Unlock Audio Chapter
Sign up and enroll to access the full audio experience
Chapter Content
The Double Mass Curve (DMC) technique is the most commonly used method to check consistency.
Detailed Explanation
The Double Mass Curve Method (DMC) is recognized as a primary tool for determining the consistency of rainfall data across various stations. By comparing the cumulative rainfall of a specific station against the cumulative rainfall of neighboring stations, any inconsistencies in the data can be visually identified. This method is pivotal because it allows hydrologists to quickly ascertain if changes in recorded data are due to actual meteorological changes or errors in observation.
Examples & Analogies
Imagine you’re comparing your weekly spending with that of a friend who lives nearby. If your spending patterns suddenly spike while your friend's stays consistent, you might wonder if there’s an error in your tracking or if your spending habits have genuinely changed. Similarly, the DMC method helps identify if the rainfall at one station diverges from expected patterns based on nearby stations.
Procedure of the Double Mass Curve Method
Chapter 2 of 4
🔒 Unlock Audio Chapter
Sign up and enroll to access the full audio experience
Chapter Content
Procedure:
1. Select the station under investigation and 4–6 neighboring stations with long, overlapping records.
2. Plot cumulative rainfall of the station in question on the Y-axis versus the cumulative average rainfall of neighboring stations on the X-axis.
3. Analyze the graph:
- A straight line implies consistency.
- A change in slope indicates a shift in recording conditions (inconsistency).
Detailed Explanation
The DMC method consists of specific steps designed to analyze rainfall data effectively. First, you select one station along with 4 to 6 neighboring stations that have long-term records. This ensures data validity by allowing for a broad regional comparison. After plotting the respective cumulative rainfall figures on a graph, a straight line would suggest that rainfall at the station is consistent with that of nearby stations. Conversely, a change in the slope of the plotted line indicates a problem; it shows a point of inconsistency that warrants further investigation.
Examples & Analogies
Think of it like tracking your academic performance against that of your classmates. If your grades plot to form a straight line similar to theirs, you might be on track. If your grades suddenly improve or drop sharply while your classmates’ grades remain steady, it becomes apparent that something might have changed, prompting you to investigate whether it’s due to a new study method or just a fluke.
Adjustment of Inconsistent Data
Chapter 3 of 4
🔒 Unlock Audio Chapter
Sign up and enroll to access the full audio experience
Chapter Content
Adjustment: To correct inconsistent data:
- Identify the year or point where inconsistency begins.
- Compute correction factor (slope ratio).
- Adjust all rainfall values after that point using the factor.
Detailed Explanation
Once inconsistencies are identified, it is crucial to adjust the data to restore its reliability. This process begins with pinpointing the exact point in time when the inconsistency first occurred. From there, a correction factor is calculated, typically based on the slope ratio from the DMC analysis. This factor is then applied to all subsequent rainfall values, enabling hydrologists to amend the record and ensure accurate data for future analysis.
Examples & Analogies
Imagine you’re trying to estimate your average daily exercise but realize you accidentally counted some days when you didn’t work out. After identifying those days, you calculate your average based only on the accurate remaining days. By adjusting your numbers this way, you'll have a more truthful picture of your fitness habits.
Advantages and Limitations of the Double Mass Curve Method
Chapter 4 of 4
🔒 Unlock Audio Chapter
Sign up and enroll to access the full audio experience
Chapter Content
Advantages:
- Simple graphical method.
- Easily identifies point of change.
Limitations:
- Requires data from multiple neighboring stations.
- Less effective if neighboring stations are also inconsistent.
Detailed Explanation
The Double Mass Curve Method offers notable advantages: it is relatively straightforward to understand and implement, providing a clear visual representation of data consistency. However, it also has limitations; it relies heavily on surrounding stations having consistent data themselves. If neighboring stations exhibit inconsistencies, this could lead to erroneous conclusions. Therefore, it is essential for practitioners to select neighboring stations judiciously for accurate assessments.
Examples & Analogies
Consider a student relying on study groups for academic help. If all members of the group misunderstand a topic, their collective input could mislead the student. Conversely, if at least a few peers are clear on the subject, the student can achieve a balanced understanding.
Key Concepts
-
Double Mass Curve Method: A graphical method for checking consistency in rainfall recordings by comparing cumulative data.
-
Homogeneity Testing: A suite of statistical tests aimed at identifying inconsistencies in time-series data.
-
Standard Normal Homogeneity Test (SNHT): A key statistical test that analyzes mean shifts in time-series data.
-
Pettitt's Test: A non-parametric test useful for detecting abrupt changes in historical rainfall data.
-
Buishand’s Range Test: A method focused on determining shifts in mean values of rainfall sequences.
Examples & Applications
Using the Double Mass Curve method, a hydrologist identifies that a station's readings have changed due to urban development, signaling the need for data adjustment.
A hydrologist applies Pettitt’s Test to a rainfall series and finds a significant change point, indicating an abrupt climatic shift.
Memory Aids
Interactive tools to help you remember key concepts
Rhymes
If rainfall data seems askew, a straight line means it's true.
Stories
Imagine a rain gauge at a park and then surrounded by new buildings. If the readings suddenly spike, a careful check with the Double Mass Curve helps reveal whether it’s real or just from the new skyline.
Memory Tools
Remember DMC: Data, Measure, Correct. That’s how we handle rainfall records!
Acronyms
H.E.L.P for Homogeneity Testing
Homogeneity
Evaluate
Locate points
Precision needs.
Flash Cards
Glossary
- Double Mass Curve (DMC)
A graphical method used to check the consistency of rainfall records by plotting cumulative rainfall of a station against its neighboring stations.
- Homogeneity Testing
Statistical tests applied to assess the consistency of time-series data, identifying points of change or inconsistency.
- Standard Normal Homogeneity Test (SNHT)
A statistical test that used standard normal variates to check for changes in the mean of time-series data.
- Pettitt’s Test
A non-parametric statistical test used to identify a single change-point in a time-series data set.
- Buishand’s Range Test
A statistical method for detecting shifts in the mean of a normal distribution rainfall series.
Reference links
Supplementary resources to enhance your learning experience.