
Estimation Techniques
Enroll to start learning
You’ve not yet enrolled in this course. Please enroll for free to listen to audio lessons, classroom podcasts and take practice test.
Interactive Audio Lesson
Listen to a student-teacher conversation explaining the topic in a relatable way.
Arithmetic Mean Method
🔒 Unlock Audio Lesson
Sign up and enroll to listen to this audio lesson

Today, we'll start with the Arithmetic Mean Method. This method is best used when nearby rainfall measurements are uniform, meaning there's little variation in their amounts. Can anyone tell me what that means?

Does it mean the rainfall amounts are pretty much the same across those stations?
Exactly! When the variation is less than 10%, we can use the Arithmetic Mean for simplicity. The formula is P_x = (∑P_i) / n. Does anyone remember what P_x represents?

Isn't P_x the missing rainfall value at the station?
Right! It’s essential to remember that this method has advantages, like being quick and simple, but it's not effective in uneven terrains. Now, why do you think this is so?

Because in uneven terrains, the rainfall can vary a lot more, making averages misleading?
Spot on! Understanding terrain variations is crucial when selecting estimation techniques.
Normal Ratio Method
🔒 Unlock Audio Lesson
Sign up and enroll to listen to this audio lesson

Next, we will explore the Normal Ratio Method. This is particularly useful when surrounding stations show a rainfall difference greater than 10%. Can anyone point out what the formula is?

I think it's P_x = (∑(N_x * P_i) / n*N_i)?
Well done! In this method, N is the normal rainfall amount. This technique adjusts the observed amounts to account for climatic variability. Why do you think we need to use long-term normal values?
Because without a long-term record, we can't accurately represent typical rainfall!
Correct! And while this method is beneficial, it does rely on historical data, which can be a limitation. Can someone think of a scenario where this might not work?
If there were no reliable normal records available, it wouldn’t work!
Exactly! Always check the data availability before applying this method.
Inverse Distance Weighting Method
🔒 Unlock Audio Lesson
Sign up and enroll to listen to this audio lesson
Now, let’s discuss the Inverse Distance Weighting Method, often abbreviated as IDW. This approach uses the distance between the target station and neighboring stations. Why do you think proximity matters?
Closer stations likely have more similar rainfall patterns!
Exactly right! The formula, P_x = (∑(P_i / d^2_i) / ∑(1/d^2_i)), gives more weight to those closer stations. What are some advantages of this method?
It can consider spatial variations!
Yes! However, can anyone recall a limitation?
It requires accurate distance data, which can be hard to obtain sometimes.
Spot on! This is a good reminder that even useful techniques have their challenges.
Multiple Regression Method
🔒 Unlock Audio Lesson
Sign up and enroll to listen to this audio lesson
Lastly, let's talk about the Multiple Regression Method, a bit more complex but extremely powerful. This method leverages relationships between multiple stations. What do you think makes this method highly accurate?
Using correlated data from several reliable stations makes it more precise!
Correct! But it’s important to remember that it requires computational analysis. Who remembers one of the steps needed before we use this method?
We should collect data from nearby stations first!
Exactly! And that can be a challenge too. As noted, it's sensitive to outliers. What was meant by that?
If one data point is very different, it can skew our results!
Nailed it! Understanding each method's application and limitations is key for accurate estimations.
Introduction & Overview
Read summaries of the section's main ideas at different levels of detail.
Quick Overview
Standard
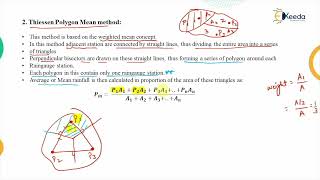
Estimation Techniques covers methods like Arithmetic Mean, Normal Ratio, Inverse Distance Weighting, and Multiple Regression for filling gaps in rainfall data. It provides formulas, application conditions, advantages, and limitations for each method, guiding students on the appropriate circumstances for their use in hydrological projects.
Detailed
Estimation Techniques
This section focuses on significant estimation methods utilized for addressing missing rainfall data, a crucial aspect of hydrological research and project planning.
Key Techniques discussed:
- Arithmetic Mean Method: Suitable for uniform adjacent rainfall patterns, this method is straightforward but less accurate in varying terrains.
- Formula: P_x = (∑P_i) / n
- Advantages: Quick computation, effective in flat terrains.
- Limitations: Often inadequate in regions with variable rain patterns.
- Normal Ratio Method: This method is beneficial when surrounding raindrop levels deviate notably (≥10%). It adjusts extremes through a calculated ratio of normal to observed rainfall.
- Formula: P_x = (∑(N_x * P_i) / n*N_i)
- Advantages: Accounts for climate variances.
- Limitations: Needs historical normal data.
- Inverse Distance Weighting (IDW): This technique leverages geographical proximity between the target site and nearby stations, weighing neighboring data according to distance.
- Formula: P_x = (∑(P_i / d^2_i) / ∑(1/d^2_i))
- Advantages: Incorporates spatial correlations.
- Limitations: Efficiency drops in irregular terrains without clear distance data.
- Multiple Regression Method: Uses statistical relationships between various rain gauge sites to estimate missing values based on a linear model, provided data is consistent and reliable.
- Procedure: Data is collected, analyzed through regression, and applied for prediction.
- Advantages: High accuracy when correlation is strong.
- Limitations: Dependent on advanced computational methods and susceptible to data anomalies.
Each method's choice is influenced by factors like missing data length and the homogeneity of neighboring stations. Understanding these methods ensures that hydrologists can fill missing gaps effectively, contributing to the reliability of ongoing research and project planning.
Youtube Videos


Audio Book
Dive deep into the subject with an immersive audiobook experience.
Arithmetic Mean Method
Chapter 1 of 4
🔒 Unlock Audio Chapter
Sign up and enroll to access the full audio experience
Chapter Content
Arithmetic Mean Method
Applicability: When rainfall at surrounding stations is fairly uniform (variation <10%).
Formula:
\[ P = \frac{1}{n} \sum_{i=1}^{n} P_i \]
Where:
- \( P \) = missing rainfall value at station X
- \( P_i \) = rainfall at ith neighboring station
- \( n \) = number of neighboring stations
Advantages:
- Simple and quick.
- Good for flat terrains.
Limitations:
- Inaccurate in non-uniform orographic regions.
Detailed Explanation
The Arithmetic Mean Method is used when the rainfall values from surrounding stations are relatively close, specifically when the variation in rainfall is less than 10%. This method averages the rainfall data from neighboring stations to estimate the missing data at a specific station. The formula involves summing the rainfall amounts from all nearby stations and dividing by the number of stations to find the average. While this method is easy to apply and works well in flat areas, it becomes unreliable in regions with significant differences in rainfall due to geographic features.
Examples & Analogies
Imagine you have five friends who live nearby, and you want to estimate the total amount of rain they each received on a day when you forgot to record yours. If they all report similar amounts, it's reasonable to say you likely had a similar experience. However, if one of your friends lives on a hilltop and reported a much higher amount, relying on the average would misrepresent your own situation.
Normal Ratio Method
Chapter 2 of 4
🔒 Unlock Audio Chapter
Sign up and enroll to access the full audio experience
Chapter Content
Normal Ratio Method
Applicability: When normal rainfall at surrounding stations differs by more than 10% from the station with missing data.
Formula:
\[ P = \left( \frac{N_x}{N} \right) \sum_{i=1}^{n} P_i \]
Where:
- \( P \) = estimated rainfall at station X
- \( N_x \) = normal rainfall at station X
- \( N \) = normal rainfall at station i
- \( P_i \) = observed rainfall at station i
Advantages:
- Adjusts for climatic variability.
Limitations:
- Requires long-term normals.
Detailed Explanation
The Normal Ratio Method is applied when the normal rainfall amounts at stations around the missing data station vary significantly, that is more than 10%. This method adjusts the observed rainfall data based on the historical average rainfall (known as normals) at the missing station relative to its neighbors. It involves calculating a ratio of the normal rainfall at the target station to the normals of surrounding stations, and then applying this ratio to the observed rainfalls to generate an estimate. Though effective, this method requires good historical data over a long period to determine these normals accurately.
Examples & Analogies
Think of it like adjusting a recipe. If you're baking cookies and your friend's oven is set to a different temperature (as their normal), it would make sense to modify the cooking time according to that difference when sharing the recipe or serving the cookies to ensure they're cooked just right.
Inverse Distance Weighting Method (IDW)
Chapter 3 of 4
🔒 Unlock Audio Chapter
Sign up and enroll to access the full audio experience
Chapter Content
Inverse Distance Weighting Method (IDW)
Applicability: When distances between the station with missing data and nearby stations are available.
Formula:
\[ P = \frac{\sum_{i=1}^{n} \frac{P_i}{d^2_i}}{\sum_{i=1}^{n} \frac{1}{d^2_i}} \]
Where:
- \( P \) = estimated rainfall at station X
- \( P_i \) = rainfall at station i
- \( d_i \) = distance between station i and station X
Advantages:
- Considers geographical proximity.
Limitations:
- Requires accurate distance data.
- May not work well in regions with varying topography.
Detailed Explanation
The Inverse Distance Weighting Method (IDW) estimates missing rainfall data by considering how distance affects rainfall amounts; data from stations closer to the missing data location are weighted more heavily than those further away. The method involves dividing the observed rainfall data from each nearby station by the square of its distance from the station with missing data, summing these values, and normalizing them against the sum of the weights. This increases the accuracy of the estimate by acknowledging that closer stations provide more relevant data. However, the method relies on having accurate distance measurements and might be less effective in areas with varied terrain where rainfall patterns can change dramatically over short distances.
Examples & Analogies
Imagine you lose your phone at a party, but you notice your friends who are closer to the location where you lost it start looking for it right away, while those on the other side of the room take longer. It makes sense that the ones closer would have a better idea of where to find it. Similarly, the IDW method gives more weight to nearby rainfall stations when making estimations.
Multiple Regression Method
Chapter 4 of 4
🔒 Unlock Audio Chapter
Sign up and enroll to access the full audio experience
Chapter Content
Multiple Regression Method
Applicability: When relationships between rainfall at different stations are linear and statistically significant.
General Form:
\[ P = a_1 P_1 + a_2 P_2 + ... + a_n P_n + C \]
Where:
- \( P_1, P_2, \ldots, P_n \) are rainfall values at neighboring stations
- \( a_1, a_2, \ldots, a_n, C \) are regression coefficients determined statistically.
Procedure:
1. Collect data from nearby stations.
2. Conduct regression analysis.
3. Apply regression equation for estimation.
Advantages:
- Highly accurate if data is consistent.
- Captures correlation among stations.
Limitations:
- Requires computational tools.
- Sensitive to outliers.
Detailed Explanation
The Multiple Regression Method is a statistical approach used when there is a clear linear relationship between the rainfall amounts at different stations. In this method, data from multiple neighboring stations is collected, and a regression analysis is performed to determine coefficients that represent the relationship between the rainfall at the target station and those at neighboring locations. The resulting regression equation can then predict the missing data point. This method is highly accurate when the data is reliable and can account for interactions between multiple stations but necessitates the use of statistical software and can be affected by extreme data points (outliers).
Examples & Analogies
Consider a scenario where a student gets grades in different subjects, and you want to predict their possible score in math based on their scores in science and English. By examining how scores in those subjects relate to each other, you can use a regression model to make an educated guess. Similarly, in rainfall analysis, this method understands how data from various weather stations correlates to better estimate missing values.
Key Concepts
-
Estimation Techniques: Methods for estimating missing data in rainfall records.
-
Arithmetic Mean: Simple averaging technique for uniform rainfall data.
-
Normal Ratio: Adjusts rainfall estimates based on climatic variations.
-
Inverse Distance Weighting: Data-driven approach that weighs observations based on distance.
-
Multiple Regression: Statistical method analyzing relationships among multiple data points.
Examples & Applications
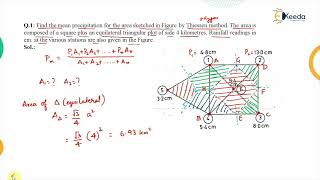
Example of using the Arithmetic Mean Method: If three surrounding stations recorded rainfall of 100 mm, 105 mm, and 95 mm respectively, the estimated missing value for another station would be (100+105+95)/3 = 100 mm.
Example of Normal Ratio Method: If a missing station's normal rainfall is 120 mm but surrounding stations recorded a normal rainfall of 110 mm, the adjustment would be applied to estimate the missing rainfall.
Memory Aids
Interactive tools to help you remember key concepts
Rhymes
For rainfall data that you lack, the Arithmetic Mean will take you back; but in terrain that's not so flat, beware the risks — avoid the spat.
Stories
Imagine a scientist collecting rainfall data from various stations. She knows her friend’s rainfall is consistent, so she averages their readings. However, when she sees a huge difference in another area, she uses different methods to make a fair estimate.
Memory Tools
To remember the estimation methods, think 'A Normal Interval Matters': A for Arithmetic mean, N for Normal ratio, I for Inverse Distance, and M for Multiple Regression.
Acronyms
Use the acronym 'ANIM'. A for Arithmetic, N for Normal, I for Inverse Distance, and M for Multiple Regression.
Flash Cards
Glossary
- Arithmetic Mean Method
A technique for estimating missing rainfall data by averaging data from neighboring stations when rainfall is uniformly distributed.
- Normal Ratio Method
Estimation for missing rainfall data using the normal rainfall ratio from surrounding stations when differences exceed 10%.
- Inverse Distance Weighting (IDW)
A method that estimates values based on the proximity of nearby stations, giving more weight to closer data.
- Multiple Regression Method
An estimation technique based on evaluating relationships and correlations between multiple rainfall stations.
Reference links
Supplementary resources to enhance your learning experience.