
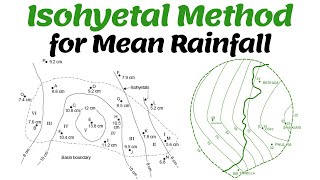
Isohyetal Method
Enroll to start learning
You’ve not yet enrolled in this course. Please enroll for free to listen to audio lessons, classroom podcasts and take practice test.
Interactive Audio Lesson
Listen to a student-teacher conversation explaining the topic in a relatable way.
Concept and Purpose of the Isohyetal Method
🔒 Unlock Audio Lesson
Sign up and enroll to listen to this audio lesson

Good morning class! Today we're discussing the Isohyetal Method. Can anyone tell me what they think this might involve?

Is it something to do with rainfall and measuring it?
Yes, exactly! The Isohyetal Method is about estimating rainfall over an area by drawing lines that connect points with the same amount of rainfall, called isohyets.

What makes it better than other methods?
Great question! The Isohyetal Method is considered more accurate because it accounts for spatial gradients in rainfall instead of just averaging. This means it gives a better picture of how rainfall varies across a region.

So, is it like contour lines on a topographic map?
Exactly, Student_3! Just as contour lines connect points of equal elevation, isohyets connect points of equal rainfall. This visual representation helps us understand rainfall distributions better.
To summarize, the Isohyetal Method allows for a detailed understanding of rainfall across a landscape, accounting for variations and gradients.
Steps of Construction
🔒 Unlock Audio Lesson
Sign up and enroll to listen to this audio lesson

Now that we know the purpose of the Isohyetal Method, let's talk about how we actually construct isohyets. Can anyone outline the first step?

Do we need to plot the rain gauge locations on a map?
Exactly! The first step involves plotting the catchment boundary and marking all rain gauge stations with recorded rainfall values. After that, what do we do?
We interpolate the rainfall between the stations!
Right! By interpolating, we can create our isohyets. Then, we measure the areas between each pair of isohyets. Why is this important?
Because each area will help us calculate the average rainfall for that zone!
Exactly! And we do this by taking the mean of the two isohyets that bound the area. Finally, we can compute the area-weighted average rainfall for the entire catchment.
To recap, we plot, interpolate, divide into zones, calculate areas, assign average precipitation, and finally compute weighted averages.
Key Considerations for the Isohyetal Method
🔒 Unlock Audio Lesson
Sign up and enroll to listen to this audio lesson
As we wrap up our discussion, it’s crucial to understand some key considerations when using the Isohyetal Method. What do you think is important to remember?
Maybe about the accuracy of the isohyets drawn?
Correct! Accurate interpolation is vital. The rainfall contours need to accurately reflect spatial patterns, and we should avoid crossing lines unless justified by topography.
And we need a lot of measurement stations, right?
Absolutely! A dense network of rain gauge stations improves reliability. Without enough data, our isohyets might lead to errors. Excellent observations, everyone!
In summary, interpolation accuracy and sufficient station density are key to successful application of the Isohyetal Method.
Merits and Demerits of the Isohyetal Method
🔒 Unlock Audio Lesson
Sign up and enroll to listen to this audio lesson
Let's discuss the strengths and weaknesses of the Isohyetal Method. What are some advantages?
It’s more accurate than simpler methods!
Correct! It reflects spatial variations and accounts for topographic influences when done well. Any drawbacks?
It takes a lot of time to do, right?
Yes, it can be time-consuming and requires a skilled hand to draw isohyets effectively. Also, it can be subjective; different people might produce different results.
So, it needs a lot of resources to do well?
Exactly! The need for a dense network of rain gauges can be a limitation, especially in less accessible areas. To summarize, while this method is highly accurate, it is demanding in terms of time and expertise.
Introduction & Overview
Read summaries of the section's main ideas at different levels of detail.
Quick Overview
Standard
This method provides a more accurate estimation of rainfall across a catchment area compared to simpler methods by incorporating spatial gradients and interpolation. The process involves plotting rain gauge locations, interpolating between stations, and measuring the area between isohyets to calculate area-weighted average rainfall.
Detailed
Isohyetal Method
The Isohyetal Method is a sophisticated contouring technique employed to estimate areal precipitation, identifying isohyets, or lines that connect areas of equal rainfall depth. This technique stands out due to its ability to integrate the spatial variations of rainfall, making it particularly useful in hydrological analyses. The method begins with the plotting of catchment boundaries and rain gauge locations, where rainfall data is collected. One key advantage is its reliance on interpolation between the recorded values at various stations, which helps in constructing isohyets that accurately depict rainfall distribution across an area.
Subsequent steps include dividing the catchment into zones delineated by the isohyets, calculating the area between them, and assigning average precipitation values to these zones. By using the average rainfall between two isohyets, the method facilitates the calculation of area-weighted average rainfall. Overall, the Isohyetal Method is favored for its accuracy, although it requires a dense network of rain gauges and the expertise of the individual applying it.
Youtube Videos


Audio Book
Dive deep into the subject with an immersive audiobook experience.
Concept and Purpose
Chapter 1 of 5
🔒 Unlock Audio Chapter
Sign up and enroll to access the full audio experience
Chapter Content
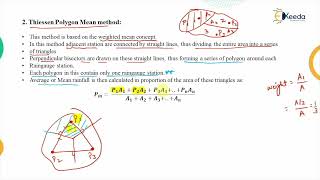
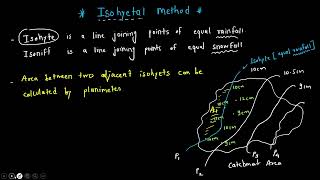
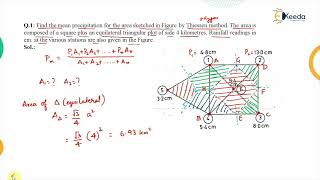
The Isohyetal Method is a contouring technique used to estimate areal precipitation. It involves drawing isohyets, which are lines connecting points of equal rainfall depth, based on measurements from different stations. This method is considered more accurate than Theissen’s because it incorporates spatial rainfall gradients and allows interpolation between stations.
Detailed Explanation
The Isohyetal Method works by using contour lines, known as isohyets, to visually represent rainfall data. These lines connect points that receive the same amount of rainfall, allowing for a more comprehensive view of how precipitation varies over an area. Unlike the Theissen Polygon Method that simplifies rainfall distribution, the Isohyetal Method acknowledges the gradual changes in rainfall intensity, making it more reliable especially in areas with varying topography.
Examples & Analogies
Imagine you're looking at a topographic map of a mountain range. Just as contour lines indicate elevation, isohyets show how rainfall changes across the landscape. If one part of the mountain gets 10 inches of rain while another gets 5 inches, the isohyets will help represent this difference clearly, allowing for better planning and resource management.
Steps of Construction
Chapter 2 of 5
🔒 Unlock Audio Chapter
Sign up and enroll to access the full audio experience
Chapter Content
- Plot the catchment boundary and mark all rain gauge stations with recorded rainfall values.
- Interpolate rainfall between nearby stations and draw isohyets (contour lines of equal rainfall).
- Divide the catchment into zones between isohyets.
- Measure the area between each pair of isohyets.
- Assign the average precipitation to each zone, calculated as the mean of the two bounding isohyets.
- Compute the area-weighted average rainfall as:
n (cid:18) (cid:19)
P = X A i × P
avg A i
total
i=1
• where:
– A = area between two isohyets
i
– P = average rainfall between two isohyets
i
Detailed Explanation
To effectively apply the Isohyetal Method, follow these steps: First, draw the boundary of the area you're studying and mark the locations of all rain gauges that have recorded precipitation. Next, use the data from these stations to estimate rainfall amounts in between them, and sketch the corresponding isohyets. The area between these lines are then divided into different zones. You'll calculate the average rainfall for each zone based on the heights of the isohyets on either side of it. Finally, you compute the area-weighted average rainfall for the entire catchment area.
Examples & Analogies
Think of the catchment area like a large sheet of land where each rain gauge is a point of reference, much like stars in the sky. Just as astronomers connect stars to create constellations, hydrologists connect rainfall data points to create isohyets, which paint a picture of how precipitation is distributed across the area. This allows planners to understand which parts get more rain and which get less, similar to knowing which spaces in a garden get more sun or shade.
Key Considerations in Isohyetal Drawing
Chapter 3 of 5
🔒 Unlock Audio Chapter
Sign up and enroll to access the full audio experience
Chapter Content
• Use interpolation between stations to place isohyets accurately.
• Rainfall contours must follow logical patterns (e.g., they should not cross unless justified by topography).
• The denser the station network, the more reliable the isohyets.
Detailed Explanation
When drawing isohyets, it's important to interpolate—the process of estimating values between two known values. This ensures that the flow of rainfall data remains logical. Isohyets should not cross as this would indicate illogical rainfall distribution unless justified by distinct topographical changes like mountains or valleys. Furthermore, a higher number of rain gauges increases reliance on your contours as it provides a more detailed dataset to draw from.
Examples & Analogies
Imagine painting a landscape where you want to show how the light changes as you move from one side of a hill to the other. Using too few colors would yield a simplistic and potentially inaccurate representation. But if you use many shades and gradients, your painting will reflect the many variations more realistically. Similarly, having more rain gauges will give a clearer picture of how rainfall changes across the landscape.
Merits of the Isohyetal Method
Chapter 4 of 5
🔒 Unlock Audio Chapter
Sign up and enroll to access the full audio experience
Chapter Content
• Most accurate among the non-instrumental methods for estimating areal rainfall.
• Considers spatial variations and gradients of rainfall.
• Can reflect topographic influences when isohyets are drawn carefully.
Detailed Explanation
The Isohyetal Method is praised for its accuracy because it factors in how rainfall amounts can shift significantly due to geographical features. It provides a rich depiction of variability, as opposed to relying on average rainfall across a broad area. When performed carefully, the method also reflects changes in elevation and terrain, making it particularly useful in regions where these elements influence precipitation patterns.
Examples & Analogies
It's like using a detailed map of a city versus a basic outline—while a simple map might show you where the streets are, the detailed version would tell you where the hills are, where it might flood, or where traffic might be heavier. The Isohyetal Method does something similar for rainfall, ensuring that planners know where to allocate resources and prepare for water management.
Demerits of the Isohyetal Method
Chapter 5 of 5
🔒 Unlock Audio Chapter
Sign up and enroll to access the full audio experience
Chapter Content
• Time-consuming and requires experience.
• Subjective element in drawing isohyets—results may vary with person.
• Needs a dense network of rain gauge stations for better accuracy.
Detailed Explanation
While the Isohyetal Method is valuable, it does come with drawbacks. It can take a significant amount of time to complete since you have to carefully interpolate and draw the contours. Additionally, because it involves some artistic judgment in drawing isohyets, different hydrologists might produce slightly varied results based on personal interpretation. Furthermore, to achieve the best results, a close network of rain gauges is essential, or else the contours may not accurately depict actual conditions.
Examples & Analogies
Consider it like baking a complex recipe. If you don’t follow the steps precisely or if you miss an ingredient, you may not end up with the right flavor. Similarly, if a hydrologist does not accurately create the isohyet map or if there are not enough sampling stations, the results could be significantly off, leading to potential mismanagement of water resources.
Key Concepts
-
Isohyetal Method: A complex contouring approach used to estimate rainfall more accurately compared to simple averaging methods.
-
Isohyets: Key components of the Isohyetal Method that illustrate areas of equal rainfall.
-
Interpolation: A necessary technique for determining rainfall levels between measurement stations.
Examples & Applications
A hydrologist measures rainfall at several stations across a mountainous region and uses the Isohyetal Method to draw isohyets for accurate precipitation estimation.
In a flat terrain, the sparse data leads to evenly spaced isohyets, while in a hilly area, the isohyets reflect steeper gradients due to varied elevation.
Memory Aids
Interactive tools to help you remember key concepts
Rhymes
Isohyets on the map tell rainfall’s chat, connect the dots where the wetness sat.
Stories
Imagine a hydrologist exploring a rugged landscape, plotting rainfall measurements to draw smooth lines, understanding how rain lightly dances across valleys, creating a detailed picture of precipitation.
Memory Tools
I: Interpolate values, S: Sketch isohyets, O: Observe areas, H: Harvest averages, Y: Yield results.
Acronyms
I for Isohyets, S for Spatial analysis, O for Observations, H for Hydrology to remember the key aspects of the Isohyetal method.
Flash Cards
Glossary
- Isohyetal Method
A contouring technique used to estimate areal precipitation by connecting points of equal rainfall depth.
- Isohyets
Lines that connect areas with the same amount of rainfall, used in the Isohyetal Method.
- Interpolation
The process of estimating intermediate values between two known values, particularly useful in constructing isohyets.
Reference links
Supplementary resources to enhance your learning experience.