
Theissen’s and Isohyetal Methods
Enroll to start learning
You’ve not yet enrolled in this course. Please enroll for free to listen to audio lessons, classroom podcasts and take practice test.
Interactive Audio Lesson
Listen to a student-teacher conversation explaining the topic in a relatable way.
Introduction to Theissen Polygon Method
🔒 Unlock Audio Lesson
Sign up and enroll to listen to this audio lesson

Today, we're discussing the Theissen Polygon Method. Can anyone tell me what this method is used for?

Is it used to estimate average rainfall over an area?
Correct! It estimates area-weighted average rainfall based on point observations. We assume that each rain gauge represents rainfall over a polygonal area around it, correct?

How do we actually create these polygons?
Great question! We start by plotting the gauge locations and then draw perpendicular bisectors to form the polygons around each station.

So, the area of influence is determined geometrically?
Exactly! This geometric approach helps us understand spatial rainfall distribution better than just using a simple average.
To remember this process, think of the acronym 'POLYGON': Plot, Overlap, Line bisectors, You measure, Gauge representation, Area influence, Natural distribution.

Can you remind us of the key assumptions of this method?
Sure! The key assumptions include uniform rainfall within each polygon, ignoring topographic effects, and requiring adequate coverage by rain gauges.
In summary, the Theissen Polygon Method provides a straightforward way to analyze spatial rainfall with geometric representation.
Understanding Isohyetal Method
🔒 Unlock Audio Lesson
Sign up and enroll to listen to this audio lesson

Now, let’s shift focus to the Isohyetal Method. What can anyone tell me about how this method differs from Theissen's?
It uses contour lines instead of polygons, right?
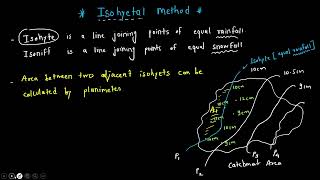
Exactly! Isohyets are lines connecting points with equal rainfall depth, allowing for a finer interpolation between stations.
Does that make it more accurate too?
Yes! Its ability to capture spatial gradients of rainfall makes it more accurate than Theissen's method, especially in regions with steep precipitation gradients.
What’s involved in drawing the isohyets?
Good question. First, we plot the rainfall data, then interpolate, and finally connect points to draw isohyets. It's essential that these contours follow logical patterns.
Are there any downsides to this method?
Indeed! It can be time-consuming and requires a dense network of rain gauges. Drawing isohyets also involves some subjectivity depending on the analyst’s experience.
Remember, the acronym 'CONTOUR' can help you recall important elements: Coordinates, Observations, Natural patterns, Topography, Outcome, Units, Repeatability.
In summary, the Isohyetal Method provides a detailed and more accurate representation of rainfall distribution compared to the Theissen Method.
Comparison and Applications
🔒 Unlock Audio Lesson
Sign up and enroll to listen to this audio lesson
Let’s compare the two methods. What are the key differences between Theissen and Isohyetal methods?
Theissen uses geometric polygons while Isohyetal uses contour lines.
And the Isohyetal Method is generally more accurate, right?
Correct! While Theissen is simpler and quicker to calculate, it doesn’t account for topographical influences. Isohyetal provides a better understanding of spatial rainfall variations.
When would you prefer to use one method over the other?
Great question! Theissen is suitable for preliminary studies in small watersheds, while Isohyetal is preferred in complex, hydrologically significant regions.
What about modern tools? Do they help with these methods?
Absolutely! GIS tools enhance the efficiency of both methods, allowing for automated isohyet drawing and better accuracy using digital elevation models.
To sum it up, both methods have their place in hydrology, with Isohyetal offering greater accuracy when the network of rain gauges allows for detailed mapping.
Introduction & Overview
Read summaries of the section's main ideas at different levels of detail.
Quick Overview
Standard
The chapter explores two widely used methods in hydrology, the Theissen Polygon Method and the Isohyetal Method, detailing their concepts, construction steps, assumptions, advantages, and disadvantages. It compares the two methods, noting their applications and modern enhancements using GIS technology.
Detailed
Theissen’s and Isohyetal Methods
Estimating average precipitation across a drainage basin is essential for several hydrological tasks. Rainfall, typically recorded at discrete stations, demands reliable interpolation techniques to understand its spatial distribution. This chapter focuses on two prevalent methods: Theissen Polygon Method and Isohyetal Method.
Theissen Polygon Method employs geometric approximation to derive area-weighted average rainfall. The method involves constructing polygons around each rain gauge station, whereby each gauge is assumed to represent rainfall over the area within its polygon. The method's straightforward construction and ease of application make it suitable for small to medium-sized catchments, though it has limitations such as neglecting topographic influences.
In contrast, the Isohyetal Method relies on contouring, creating isohyets—lines connecting points of equal rainfall. This method is generally more accurate as it accounts for spatial gradients and allows for more refined interpolation between stations. Its advantages come with greater complexity, requiring a denser network of rain gauges for best results.
The section ends with a comparison of both methods, highlighting their merits and demerits, their applicable scenarios, and the adoption of GIS technology to enhance their effectiveness in modern hydrology.
Youtube Videos

Audio Book
Dive deep into the subject with an immersive audiobook experience.
Introduction to Precipitation Estimation
Chapter 1 of 12
🔒 Unlock Audio Chapter
Sign up and enroll to access the full audio experience
Chapter Content
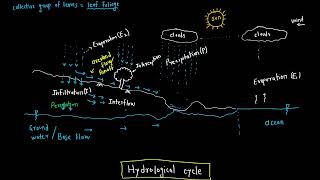
In hydrology, estimating the average precipitation over a catchment or a drainage basin is crucial for design and analysis tasks such as flood estimation, reservoir operation, and water resource planning. Since rainfall is recorded at discrete stations, we need techniques to interpolate or estimate how rainfall varies over the entire area. Two of the most commonly used methods for such are:
• Theissen Polygon Method
• Isohyetal Method
These methods provide spatial averaging of rainfall based on either geometrical approximation (Theissen) or contouring based on observed values (Isohyetal). This chapter explores these two methods in full detail, covering construction, assumptions, advantages, and applications.
Detailed Explanation
This introduction explains the importance of estimating average rainfall in hydrology and the limitations of measuring rainfall at discrete stations. It introduces two methods, Theissen Polygon and Isohyetal, which are used to estimate rainfall over larger areas. Theissen uses geometric approximation while Isohyetal employs contour lines based on actual observations.
Examples & Analogies
Imagine you're trying to find out how much it rained in your whole town, but you only have rainfall data from a few weather stations spread across different neighborhoods. The methods described help you create a clearer picture of how much rain fell across the entire town instead of just at those few points.
Theissen Polygon Method Overview
Chapter 2 of 12
🔒 Unlock Audio Chapter
Sign up and enroll to access the full audio experience
Chapter Content
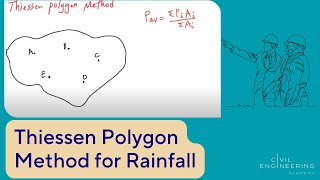
The Theissen Polygon Method (also known as the Thiessen Method) is a geometrical approach used to estimate area-weighted average rainfall from point observations at rain gauge stations. It assumes that each station is responsible for rainfall over a specific area, bounded by polygons constructed around the stations.
Detailed Explanation
The Theissen Polygon Method divides the area into polygons around each rain gauge station. It assumes each station influences the rainfall amount in its polygon, which allows for a more accurate average rainfall calculation by considering the area each station covers.
Examples & Analogies
Think of each rain gauge as a school in a district. Each school (gauge) serves a certain area (polygon) of students. The overall performance (rainfall) of the district (catchment) can be understood by averaging the performance of each school within its area.
Steps of Theissen Polygon Method Construction
Chapter 3 of 12
🔒 Unlock Audio Chapter
Sign up and enroll to access the full audio experience
Chapter Content
- Plot the catchment area on a map and mark the location of all rain gauge stations.
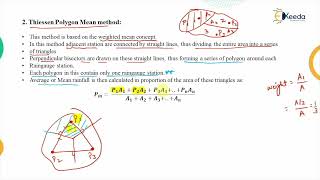
- Connect adjacent stations with straight lines to form triangles (Triangulation).
- Draw perpendicular bisectors of each line connecting two adjacent stations.
- The intersection of perpendicular bisectors creates polygons around each station.
- Each polygon defines the area of influence of that rain gauge.
- Measure the area of each polygon using a planimeter or CAD tools.
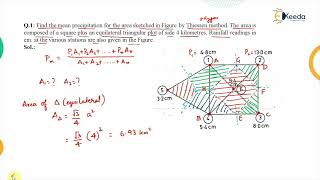
- Calculate weighted average rainfall as:
P_avg = Σ(A_i × P_i) / A_total
• where:
– A_i = area of the ith polygon
– A_total = total catchment area
– P_i = precipitation at ith station.
Detailed Explanation
These steps detail how to create Theissen polygons. By connecting stations and finding their bisectors, you form polygons that indicate the influence of each station. Once areas are calculated, you can apply the average precipitation formula to find the overall average rainfall across the catchment.
Examples & Analogies
Imagine laying out a neighborhood map where each house (rain gauge) influences a section of the street (polygon) around it. The area each house influences can be measured, and the total performance (average rainfall) for the whole neighborhood is calculated based on how much rain falls in each section.
Assumptions of Theissen Polygon Method
Chapter 4 of 12
🔒 Unlock Audio Chapter
Sign up and enroll to access the full audio experience
Chapter Content
• Rainfall is uniformly distributed within each polygon.
• No orographic or topographic influence is considered.
• The catchment area is adequately covered by rain gauges.
Detailed Explanation
This section outlines the assumptions behind the Theissen method. The key assumption is that rainfall distribution is uniform across each polygon, which may not always hold true. It also notes that the method does not account for variations caused by elevation or terrain, and that adequate coverage of rain gauges is necessary for reliable results.
Examples & Analogies
Imagine you're at a picnic in a flat park where you're assuming everyone under the trees is getting the same amount of rain. If it starts to pour, some areas might be getting drenched more than others due to things like hills nearby preventing rain from falling evenly, just like orographic effects in real life.
Merits and Demerits of Theissen Polygon Method
Chapter 5 of 12
🔒 Unlock Audio Chapter
Sign up and enroll to access the full audio experience
Chapter Content
Merits:
• Simple and easy to apply.
• Useful for small to medium-sized catchments.
• Accounts for spatial variability better than the arithmetic mean method.
Demerits:
• Ignores elevation and topographical features.
• Accuracy depends on the proper distribution of stations.
• Sharp boundaries are unrealistic in natural rainfall distribution.
Detailed Explanation
The merits highlight the method's simplicity and suitability for small areas, as well as its better consideration of spatial variability compared to basic averaging. However, its limitations include its disregard for elevation and needing an appropriate number of stations to function effectively, as well as its unrealistic straight boundaries in nature.
Examples & Analogies
Think of the Theissen method as a simple recipe for a cake—it works well if you follow the ingredients closely (having good data). If your pan (the catchment area) is small, it’s easier to get the right shape, but if you try to spread that recipe over a bigger terrain with hills or dips, the cake might not rise evenly!
Isohyetal Method Overview
Chapter 6 of 12
🔒 Unlock Audio Chapter
Sign up and enroll to access the full audio experience
Chapter Content
The Isohyetal Method is a contouring technique used to estimate areal precipitation. It involves drawing isohyets, which are lines connecting points of equal rainfall depth, based on measurements from different stations. This method is considered more accurate than Theissen’s because it incorporates spatial rainfall gradients and allows interpolation between stations.
Detailed Explanation
The Isohyetal Method differs in that it uses contour lines (isohyets) to connect areas of equal rainfall. This approach takes into account gradients and variations in rainfall, leading to potentially more accurate estimates, especially in regions where rainfall differs significantly.
Examples & Analogies
Imagine drawing a map of a mountain range with contours showing elevation. Just like how the height changes across the landscape, the Isohyetal Method shows how rainfall amounts vary across the area, allowing for a more detailed understanding of where more rain is falling.
Steps of Isohyetal Method Construction
Chapter 7 of 12
🔒 Unlock Audio Chapter
Sign up and enroll to access the full audio experience
Chapter Content
- Plot the catchment boundary and mark all rain gauge stations with recorded rainfall values.
- Interpolate rainfall between nearby stations and draw isohyets (contour lines of equal rainfall).
- Divide the catchment into zones between isohyets.
- Measure the area between each pair of isohyets.
- Assign the average precipitation to each zone, calculated as the mean of the two bounding isohyets.
- Compute the area-weighted average rainfall as:
P_avg = Σ(A_i × P_i) / A_total
• where:
– A_i = area between two isohyets
– P_i = average rainfall between two isohyets.
Detailed Explanation
This section provides a systematic approach to construct isohyets. The process begins with marking stations and then involves interpolating between the measured rainfall amounts to draw isohyets. By segmenting the area and calculating average precipitation for each zone, the overall average rainfall can be computed using the area-weighted average formula.
Examples & Analogies
It’s like creating a map of a water park where you mark different areas showing how deep the water is in different pools. By tracing different water depths (isohyets), you get a good visual of where the most and least water is, giving you an overall understanding when planning for a big day at the park!
Key Considerations in Isohyetal Drawing
Chapter 8 of 12
🔒 Unlock Audio Chapter
Sign up and enroll to access the full audio experience
Chapter Content
• Use interpolation between stations to place isohyets accurately.
• Rainfall contours must follow logical patterns (e.g., they should not cross unless justified by topography).
• The denser the station network, the more reliable the isohyets.
Detailed Explanation
This part stresses the importance of careful and logical placement of isohyets. Accurate interpolation is critical, as illogical contours might misrepresent rainfall distribution. Additionally, a denser network of rain gauges will provide better data, leading to more reliable isohyets.
Examples & Analogies
Think of a road map where every major intersection is highlighted by traffic signals. If you miss an important intersection (rain gauge), it could lead to confusion about how traffic (rain) flows on the roads. The more 'traffic signals' (gages) you have, the clearer your understanding of the best routes (rainfall distribution) becomes.
Merits and Demerits of Isohyetal Method
Chapter 9 of 12
🔒 Unlock Audio Chapter
Sign up and enroll to access the full audio experience
Chapter Content
Merits:
• Most accurate among the non-instrumental methods for estimating areal rainfall.
• Considers spatial variations and gradients of rainfall.
• Can reflect topographic influences when isohyets are drawn carefully.
Demerits:
• Time-consuming and requires experience.
• Subjective element in drawing isohyets—results may vary with person.
• Needs a dense network of rain gauge stations for better accuracy.
Detailed Explanation
The merits of the Isohyetal Method emphasize its accuracy and its ability to capture spatial variations in rainfall, as well as how elevation can influence these amounts when contouring is performed thoughtfully. However, its drawbacks highlight the need for skilled interpretation and adequate data density, which can make it imperfect for quick assessments.
Examples & Analogies
Using the Isohyetal Method is like creating a detailed artistic representation of a landscape. If done meticulously, it reveals every hill and valley (rainfall variation) accurately. However, an artist's skill can vary, meaning two artists may portray the landscape differently, and creating the artwork takes time and resources.
Comparison Between Theissen and Isohyetal Methods
Chapter 10 of 12
🔒 Unlock Audio Chapter
Sign up and enroll to access the full audio experience
Chapter Content
Theissen Polygon Method:
• Basis: Geometric (polygonal division)
• Accuracy: Moderate
• Data Requirement: Moderate (location and rainfall data)
• Computation Time: Low to moderate
• Subjectivity: Low
• Spatial Distribution Considered: Yes (simplified)
• Topography Influence: Not considered
Isohyetal Method:
• Basis: Contour (lines of equal rainfall)
• Accuracy: High
• Data Requirement: High (more stations needed)
• Computation Time: High
• Subjectivity: High
• Spatial Distribution Considered: Yes (detailed)
• Topography Influence: Can be considered (qualitatively)
Detailed Explanation
This section compares the two methods across several dimensions, including their basis, accuracy, data requirements, computation time, and how they consider subjectivity and topography. The Isohyetal Method is generally more accurate but also requires more data and time, while Theissen is quicker and simpler but less precise.
Examples & Analogies
Consider two ways of planning a road trip: one method plots out the quickest route (Theissen), while the other provides a scenic drive through hills and valleys (Isohyetal). The first method is faster but may not capture the beauty of the journey, whereas the second is more detailed but takes longer to plan.
Application Scenarios
Chapter 11 of 12
🔒 Unlock Audio Chapter
Sign up and enroll to access the full audio experience
Chapter Content
• Theissen Method is commonly used in small watersheds, or where time/resources are limited.
• Isohyetal Method is preferred in hydrologically important or mountainous regions where rainfall gradients are steep and need accurate spatial representation.
Detailed Explanation
This section outlines where each method is best applied. The Theissen Method is practical for smaller areas or where quick results are needed, while the Isohyetal Method is suited for more complex terrains where accurate rainfall mapping is critical for water management.
Examples & Analogies
Think of a chef preparing dinner for a small family versus a banquet for a large crowd. The chef cooking for the family can use a quick recipe (Theissen), while the banquet chef must carefully plan and consider every palate (Isohyetal) to ensure the meal is perfect for everyone.
Modern Enhancements and GIS Integration
Chapter 12 of 12
🔒 Unlock Audio Chapter
Sign up and enroll to access the full audio experience
Chapter Content
Both methods can now be implemented using GIS tools like ArcGIS or QGIS, allowing for:
• Faster area calculation
• Improved accuracy through digital elevation models (DEMs)
• Automated isohyet drawing using spatial interpolation algorithms (e.g., Kriging, IDW)
Such integration reduces subjectivity and enhances the reproducibility of results, particularly for large and complex watersheds.
Detailed Explanation
This final section describes how modern Geographic Information Systems (GIS) enhance both methods, improving the speed, accuracy, and reliability of rainfall estimates. By using technology, the processes of area calculation and isohyet drawing become more efficient and less subjective, which is especially beneficial for larger catchments.
Examples & Analogies
Imagine upgrading a handwritten styled recipe into a digital format where you can instantly adjust measurements and even share it with others online. This technology not only saves time but also helps ensure that everyone achieves the same delicious results with minimal room for mistakes!
Key Concepts
-
Theissen Polygon Method: A geometric method used for area-weighted rainfall estimation based on rain gauge locations.
-
Isohyetal Method: A more accurate contouring method for estimating rainfall by drawing isohyets.
-
Interpolation: The process of estimating values between two known data points.
-
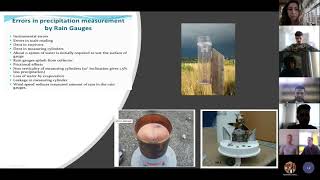
Rain Gauge: A device used for measuring the amount of liquid precipitation over a set period.
Examples & Applications
Example 1: Using Theissen Polygon Method, a hydrologist may estimate area-weighted rainfall over a small watershed with three rain gauges, showing each gauge’s influence through polygons.
Example 2: The Isohyetal Method may be employed in a mountainous region where precipitation varies significantly across elevations, allowing accurate rainfall mapping.
Memory Aids
Interactive tools to help you remember key concepts
Rhymes
The polygons help us to find, how rain falls over land defined.
Stories
Imagine a hydrologist on a rainy day, using gauge data to paint isohyets, where each stroke represents the rain received across the land.
Memory Tools
To remember Theissen’s construction: 'Ponder Over Little Useful Geometric Areas' (POLYGON).
Acronyms
For Isohyetal, think 'CORRECT'
Contour
Observations
Rainfall values
Representation
Elevation
Consistency
Topography.
Flash Cards
Glossary
- Theissen Polygon Method
A geometrical method used to estimate area-weighted average rainfall based on the position of rain gauges.
- Isohyetal Method
A contouring technique that estimates areal rainfall by drawing lines connecting points of equal rainfall depth.
- Isohyets
Lines that connect points of equal rainfall depth on a map.
- Geometric Approximation
The process of using geometric shapes to represent areas, such as polygons around rain gauges.
- Spatial Interpolation
The process of estimating unknown values by using known values at surrounding points.
Reference links
Supplementary resources to enhance your learning experience.