
Modern Enhancements and GIS Integration
Enroll to start learning
You’ve not yet enrolled in this course. Please enroll for free to listen to audio lessons, classroom podcasts and take practice test.
Interactive Audio Lesson
Listen to a student-teacher conversation explaining the topic in a relatable way.
Introduction to GIS Integration
🔒 Unlock Audio Lesson
Sign up and enroll to listen to this audio lesson

Today, we'll discuss how Geographic Information Systems, or GIS, have transformed rainfall estimation methods in hydrology. Can anyone tell me what GIS stands for?

Isn't it Geographical Information Systems?
Correct! GIS helps us analyze spatial data effectively. How do you think this technology could impact rainfall estimation?

I imagine it makes the calculations much faster!
Exactly! GIS tools like ArcGIS or QGIS significantly reduce the time taken to compute areas compared to traditional methods. Remember, speed is critical in hydrology!
Benefits of Digital Elevation Models (DEMs)
🔒 Unlock Audio Lesson
Sign up and enroll to listen to this audio lesson

Let's talk about Digital Elevation Models or DEMs. Student_3, can you explain why DEMs are essential in rainfall estimation?

They likely provide information about the topography of the area, which can affect rainfall distribution.
You're spot on! DEMs help us understand how terrain influences rainfall patterns. This provides more accurate results. Can anyone think of how this impacts a watershed?

Using DEMs could help identify areas prone to flooding based on elevation!
Absolutely right! It can inform our flood risk assessments.
Automated Isohyet Drawing
🔒 Unlock Audio Lesson
Sign up and enroll to listen to this audio lesson
Now, let's delve into the automated drawing of isohyets using GIS. Who can explain what an isohyet is?
Isohyets are lines connecting areas of equal rainfall on a map!
Perfect! With GIS, we can automate the creation of isohyets using spatial interpolation methods such as Kriging. Why do you think this is useful?
It reduces manual errors and saves time!
Exactly! By minimizing subjectivity, we enhance the reproducibility of our results across different studies.
Impact of Integration on Large Watersheds
🔒 Unlock Audio Lesson
Sign up and enroll to listen to this audio lesson
Let's wrap up our session with a discussion on the impact of GIS in large watersheds. Can anyone give me an example of why large areas need more precise rainfall methods?
Larger areas likely have more variable rainfall patterns due to different terrains.
Exactly! As terrain complexity increases, relying on traditional methods becomes less effective. GIS tools allow us to consider these variables better.
So, does that mean GIS makes studies more reliable?
Yes! Enhanced accuracy and speed improve our hydrological modeling efforts immensely, leading to better resource management.
Introduction & Overview
Read summaries of the section's main ideas at different levels of detail.
Quick Overview
Standard
The section highlights how GIS tools like ArcGIS and QGIS can enhance traditional rainfall estimation methods, including increased speed, accuracy, and automation, particularly benefiting large and complex watersheds.
Detailed
Modern Enhancements and GIS Integration
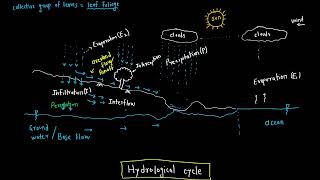
In today's hydrology, Geographic Information Systems (GIS) have revolutionized the estimation of average precipitation over catchments. The integration of GIS tools such as ArcGIS and QGIS enhances the classical methods of estimating rainfall (Theissen and Isohyetal methods) in several ways:
- Faster Area Calculation: GIS allows for quicker computation of areas associated with rainfall estimation, improving efficiency in hydrological studies.
- Improved Accuracy Using DEMs: Digital Elevation Models (DEMs) provide vital topographical context that traditional methods may overlook, leading to more reliable results.
- Automated Isohyet Drawing: By employing spatial interpolation algorithms (such as Kriging and Inverse Distance Weighting), GIS automates the drawing of isohyets, reducing manual errors and subjectivity involved in creating contour maps.
These advancements considerably enhance reproducibility and accuracy, particularly in complicated and large-scale watersheds, where traditional methods might struggle.
Youtube Videos


Audio Book
Dive deep into the subject with an immersive audiobook experience.
Introduction to GIS Integration
Chapter 1 of 5
🔒 Unlock Audio Chapter
Sign up and enroll to access the full audio experience
Chapter Content
Both methods can now be implemented using GIS tools like ArcGIS or QGIS, allowing for:
Detailed Explanation
Geographic Information Systems (GIS) have revolutionized how hydrologic modeling is conducted. With GIS tools such as ArcGIS and QGIS, both the Theissen Polygon and Isohyetal methods can be executed more efficiently. This transition to digital systems allows for better management of spatial data and enhances overall analysis.
Examples & Analogies
Imagine using a GPS for navigating a city. Just as a GPS makes it easier to find a route faster by using digital maps, GIS tools allow hydrologists to analyze data more quickly and accurately than by hand-drawing maps.
Faster Area Calculation
Chapter 2 of 5
🔒 Unlock Audio Chapter
Sign up and enroll to access the full audio experience
Chapter Content
• Faster area calculation
Detailed Explanation
One significant enhancement of using GIS is the ability to calculate areas rapidly. Instead of manually measuring polygons or segments between rain gauge stations, GIS can compute these areas in seconds using digital mapping. This efficiency saves time and reduces potential errors in calculations.
Examples & Analogies
Think about calculating the area of a park. If you were to do it by hand using paper and a ruler, it could take a long time. However, if you used a GPS app that can tell you the area of the park instantly, it would be much quicker and more accurate.
Improved Accuracy with DEMs
Chapter 3 of 5
🔒 Unlock Audio Chapter
Sign up and enroll to access the full audio experience
Chapter Content
• Improved accuracy through digital elevation models (DEMs)
Detailed Explanation
Digital Elevation Models (DEMs) provide elevation data that enhance the accuracy of rainfall estimates. The integration of DEMs allows for a better understanding of how topography affects precipitation, which is essential for accurate modeling. For instance, rainfall can vary significantly in hilly areas due to altitude changes, and GIS can account for these variations.
Examples & Analogies
Imagine trying to predict how much rain a mountain range will receive without considering its height. It would be like trying to guess how much water a sponge will soak up without considering its size. DEMs provide that 'size' information necessary for accurate analysis.
Automated Isohyet Drawing
Chapter 4 of 5
🔒 Unlock Audio Chapter
Sign up and enroll to access the full audio experience
Chapter Content
• Automated isohyet drawing using spatial interpolation algorithms (e.g., Kriging, IDW)
Detailed Explanation
GIS tools can automate the process of drawing isohyets, which are the contour lines representing equal rainfall amounts. By utilizing spatial interpolation algorithms like Kriging and Inverse Distance Weighting (IDW), GIS can generate these contours with high precision. This automation minimizes human error and enhances the reproducibility of rainfall estimates, especially in large areas.
Examples & Analogies
Consider an artist who must paint a large mural by hand. The process could take weeks and may introduce inconsistencies. However, if the artist used a sophisticated printing machine, the mural could be reproduced perfectly in a fraction of the time. Similarly, GIS automates isohyet drawing to produce consistent and precise results quickly.
Benefits of GIS Integration
Chapter 5 of 5
🔒 Unlock Audio Chapter
Sign up and enroll to access the full audio experience
Chapter Content
Such integration reduces subjectivity and enhances the reproducibility of results, particularly for large and complex watersheds.
Detailed Explanation
One of the main challenges in traditional methods is the subjective nature of drawing isohyets and analyzing spatial rainfall distribution, which can lead to variability in results based on who is conducting the analysis. By implementing GIS, which uses established algorithms and data inputs, the results become more objective and replicable, particularly beneficial for analyzing complex watersheds with varying topography and rainfall distributions.
Examples & Analogies
Imagine if each chef made a spaghetti sauce by tasting and adjusting ingredients based on their preference. Each chef's sauce would taste different. However, if they followed a precisely written recipe with exact measurements, each sauce would be consistent. GIS provides that recipe for creating rainfall estimates, leading to more reliable results.
Key Concepts
-
GIS Integration: Enhances traditional rainfall estimation methods by improving speed and accuracy.
-
DEMs: Provide essential topographical information for accurate rainfall modeling.
-
Automated Isohyet Drawing: Reduces subjectivity and manual errors in creating rainfall contour maps.
Examples & Applications
An example of GIS integration can be seen in the use of ArcGIS to analyze rainfall data in a mountainous area, providing precise isohyet maps that reflect varying rainfall due to elevation changes.
Using DEMs in rainfall estimates has been demonstrated in studies where complex terrains led to more accurate flood risk assessments.
Memory Aids
Interactive tools to help you remember key concepts
Rhymes
In a GIS map, the rain will tap, with isohyets drawn, we'll close the gap!
Stories
Imagine a hydrologist named Leo who uses GIS to uncover rainfall patterns in a mountainous region, allowing him to save towns from flooding by effectively predicting where the rain will fall.
Memory Tools
For GIS remember 'G' for Geographical, 'I' for Information, 'S' for Systems – tools to visualize spatial relations!
Acronyms
DEMs
'D' for Digital
'E' for Elevation
'M' for Models – all crucial for analyzing terrain!
Flash Cards
Glossary
- GIS
Geographic Information Systems; technology to manage, analyze, and visualize spatial data.
- DEMs
Digital Elevation Models; representations of terrain that provide elevation data.
- Isohyets
Lines on a map connecting points with equal rainfall amounts.
- Spatial Interpolation
The process of estimating values at unknown points using known values from surrounding points.
- Kriging
A geostatistical technique used for interpolation of spatial data.
- Inverse Distance Weighting (IDW)
A method for interpolating values wherein closer points have more influence on the estimated value.
Reference links
Supplementary resources to enhance your learning experience.