
Infiltration Process and Time Dependency
Enroll to start learning
You’ve not yet enrolled in this course. Please enroll for free to listen to audio lessons, classroom podcasts and take practice test.
Interactive Audio Lesson
Listen to a student-teacher conversation explaining the topic in a relatable way.
Introduction to Infiltration Process
🔒 Unlock Audio Lesson
Sign up and enroll to listen to this audio lesson

Today we'll explore the fascinating process of infiltration and how it changes over time. To start, can anyone tell me what infiltration is?

I remember it's when water goes into the soil, right?
Exactly! Infiltration is the process by which water on the ground enters the soil. There are two critical terms: the Initial Infiltration Rate, which is high at the beginning, and the Final or Steady-State Infiltration Rate that we reach after prolonged rainfall. Can anyone describe what happens to infiltration as it continues to rain?

It decreases, doesn't it?
Correct. The rate starts high and gradually decreases to a constant minimum value. We can remember this pattern as 'I' stands for Initial and 'F' for Final—'IF' for the initial to final transition!

Can we see this on a graph?
Absolutely! The infiltration curves depict this process very well, showing how the rate changes over time. This understanding is important in managing water resources effectively.
Understanding Infiltration Rates
🔒 Unlock Audio Lesson
Sign up and enroll to listen to this audio lesson

Now, let's dive deeper into those rates. Who can remind the class what the initial infiltration rate (f₀) represents?

It's the infiltration rate right at the beginning of a rainfall!
Exactly! Remember that this rate is typically high because the soil is initially dry. Now, what about the final or steady-state infiltration rate (fc)?
Isn’t that the rate after the soil absorbs water for a while?
Right again! It's important for understanding how much water the soil can continue to absorb over long periods. Can anyone think of a situation where knowing this rate would be useful?
For designing drainage systems or predicting runoff during storms?
Yes! Infiltration behavior directly correlates with flood forecast accuracy and water resource management.
Significance of Time Dependency in Infiltration
🔒 Unlock Audio Lesson
Sign up and enroll to listen to this audio lesson
Now that we understand the two rates, why do you think the time dependency of infiltration is so significant?
Maybe because it helps us predict when runoff will happen?
Precisely! Knowing how infiltration decreases helps us predict surface runoff. What could happen if we disregard this time aspect?
We might underestimate how much water stays in the soil versus what runs off!
Exactly! This kind of oversight could result in poor agricultural planning and ineffective urban drainage designs. So, remembering these rates reduces risks associated with flooding and resource depletion.
Thank you for explaining it so clearly!
Introduction & Overview
Read summaries of the section's main ideas at different levels of detail.
Quick Overview
Standard
The infiltration process is dynamic, with an initial high rate during the early stages of rainfall that decreases as soil moisture reaches saturation, eventually stabilizing at a steady-state infiltration rate. Understanding this behavior is crucial for predicting runoff and managing water resources.
Detailed
Infiltration Process and Time Dependency
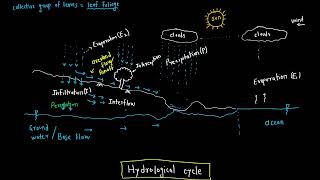
The infiltration process illustrates a significant hydrological phenomenon where the capacity of soil to absorb water changes over time. Initially, during a rainfall event, the infiltration rate is generally high, known as the Initial Infiltration Rate (f₀). As the event continues, the rate of infiltration decreases and approaches a lower, steady-state or Final Infiltration Rate (fc). This characteristic behavior is visually represented through infiltration curves that plot the rate of water absorption over time.
Understanding this time-dependent behavior of infiltration is critical for multiple applications in hydrology, such as flood forecasting and watershed management. As the period of rainfall extends, soil’s ability to further absorb water diminishes, impacting surface runoff and groundwater recharge effectiveness. Thus, knowing how infiltration and time interact is fundamental for effective water resource management.
Youtube Videos


Audio Book
Dive deep into the subject with an immersive audiobook experience.
Infiltration Capacity Over Time
Chapter 1 of 3
🔒 Unlock Audio Chapter
Sign up and enroll to access the full audio experience
Chapter Content
Infiltration capacity is not constant over time. It decreases rapidly in the early stages of a rainfall event and then gradually approaches a constant minimum value.
Detailed Explanation
The rate at which soil can absorb water during rainfall changes over time. Initially, it is very high, meaning the soil can take in a lot of water quickly. However, as rainfall continues, this rate decreases because the soil starts to become saturated or filled with water. After some time, it stabilizes at a lower rate, termed the minimum infiltration capacity.
Examples & Analogies
Think of a sponge. When you first dip a dry sponge into a bucket of water, it soaks up a lot of water quickly. But as it becomes fuller, it can't absorb as much anymore. Eventually, it reaches a point where it won’t soak up any more water, even if you keep it in the bucket.
Initial vs. Steady-State Infiltration Rates
Chapter 2 of 3
🔒 Unlock Audio Chapter
Sign up and enroll to access the full audio experience
Chapter Content
Typical infiltration behavior:
- Initial Infiltration Rate (f₀): High at the beginning.
- Final/Steady-State Infiltration Rate (fc): The constant rate achieved after prolonged rainfall.
Detailed Explanation
At the beginning of a rainfall, the infiltration rate is high because the soil is dry and can take in more water. This is known as the initial infiltration rate, denoted as f₀. After a while, as the water keeps coming and the soil fills up, the rate of infiltration slows down and finally stabilizes to a constant value known as the steady-state infiltration rate, denoted as fc. This steady-state rate is critical for understanding how much water the soil can continue to absorb over the long term.
Examples & Analogies
Imagine a person drinking water. At first, when they're quite thirsty, they drink quickly (initial infiltration). After some time, they start to slow down as they become more full (steady-state infiltration). Eventually, they stop drinking when they’re no longer thirsty, similar to how soil reaches its maximum capacity.
Infiltration Curves
Chapter 3 of 3
🔒 Unlock Audio Chapter
Sign up and enroll to access the full audio experience
Chapter Content
This behavior is often represented using infiltration curves.
Detailed Explanation
Infiltration curves graphically illustrate how the rate of water absorption by soil changes over time. These curves show the initial high rate at the beginning of a rainfall event that gradually declines and flattens out over time, indicating the transition to a steady-state infiltration rate. By analyzing these curves, we can better understand soil performance during different rainfall conditions.
Examples & Analogies
Consider a reading chart for a student's progress in learning to read. At first, their reading speed increases rapidly as they become more confident, but soon it levels off as they reach a point of proficiency where improvement happens slowly. Similarly, infiltration curves show that soil can take in water quickly at first but then levels off as it reaches capacity.
Key Concepts
-
Infiltration Process: The movement of water from the surface into the soil.
-
Time Dependency: The change in infiltration capacity over time, decreasing initially and stabilizing.
-
Initial vs. Final Rate: The distinction between high rates at the start of rainfall and stabilized rates later.
Examples & Applications
During a heavy rain, the soil can absorb water faster initially, which may help manage water runoff and support vegetation.
In urban areas, understanding infiltration rates can prevent flooding by allowing engineers to design better drainage systems.
Memory Aids
Interactive tools to help you remember key concepts
Rhymes
Infiltration starts high but soon does slow, / Water's soak up wane, like a river’s flow.
Stories
Imagine a thirsty land eagerly drinking the rain, first gulping it down quickly before it slows and settles into a steady stream.
Memory Tools
I-F for Infiltration - Initial and Final to remember the rates changing over time.
Acronyms
FIS
Final Infiltration Steady—reminder that the final rate is steady after adjustments.
Flash Cards
Glossary
- Infiltration
The process by which water on the ground surface enters the soil.
- Initial Infiltration Rate (f₀)
The rate of infiltration at the beginning of a rainfall event.
- Final Infiltration Rate (fc)
The constant rate at which soil can absorb water after prolonged rainfall.
- Infiltration Curve
A graphical representation of infiltration rates over time.
Reference links
Supplementary resources to enhance your learning experience.